
Two B2B SaaS companies running identical pipelines can report an MQL to SQL conversion rate of 13% and 47% in the same quarter — without either number being wrong. One counts every form-fill that hits a fit threshold; the other only counts leads that already cleared a PQL signal, an intent score, and a manual sales review. Same funnel, completely different denominator, completely different answer.
That’s the trap with every benchmark post on this topic. The MQL to SQL conversion rate isn’t a target you hit by tuning a scoring model — it’s a diagnostic you read against your own definition, your own GTM motion, and your own handoff. This guide gives you the formula, current 2026 benchmarks (sourced, not recycled), and the framework to read your own number.
What Is the MQL to SQL Conversion Rate?
The MQL to SQL conversion rate is the share of Marketing Qualified Leads that sales accepts as Sales Qualified Leads in a defined period. It measures whether marketing is passing leads sales can actually work — not generating volume. A high rate signals tight alignment; a low rate signals a leak between source, scoring, and handoff.
That last sentence is where this metric earns its keep. MQL→SQL conversion is the cleanest reading of marketing-sales alignment you can take without running a survey, and it moves faster than pipeline metrics. You can read it weekly, which is why a handoff problem shows up here first.
How Do You Calculate MQL to SQL Conversion Rate?
The MQL to SQL conversion rate formula is (SQLs in period / MQLs in period) × 100. Worked example: marketing generated 1,000 MQLs in March; by April, sales had accepted 180 of them as SQLs. March MQL to SQL conversion rate = (180 / 1,000) × 100 = 18%. That’s the math everyone runs, and almost everyone runs it wrong.
The trap is using the same calendar month in both numerator and denominator. If your average MQL takes 45 days to become an SQL, your same-month rate compares two cohorts that have nothing to do with each other. HubSpot’s updated guidance is explicit: if MQL→SQL takes three months in your business, compare month-three SQLs against month-one MQLs (HubSpot, updated 2025-12-26).
The fix is to lock the cohort:
MQL_to_SQL_rate (cohort) =
  SQLs_accepted_from_MQLs_created_in_period_X
  / MQLs_created_in_period_X
Notice the denominator and numerator share the same originating cohort. That’s the part most dashboards skip — and it’s covered in detail in the cohort section below.
What Is a Good MQL to SQL Conversion Rate?
A good MQL to SQL conversion rate sits between 13% and 25% for most B2B SaaS teams — ABM-led motions trend higher (25–40%), PLG-led motions run differently (PQL→SQL: 40–60%). Those ranges carry meaning only when the MQL definition is comparable across teams — which it almost never is. Treat the numbers below as directional, not as targets.
| Segment | MQL → SQL rate | Source | Year | Source quality |
|---|---|---|---|---|
| B2B average, Gartner-cited | 21% | Salesforce citing Gartner | 2024 | Analyst (cited by vendor) |
| Cross-industry range | 10–20% | HubSpot | 2025 | Vendor (compiled) |
| B2B SaaS | 13% | HubSpot citing First Page Sage | 2025 | Vendor citing agency |
| By industry: Aerospace 17% · Auto 18% · Construction 12% · Pharma 21% | varies | First Page Sage | 2026 (client data 2019–2025) | Agency client data |
| B2B SaaS, early-stage | 15–25% | Martal Group | 2026 | Vendor benchmark |
| B2B SaaS, growth-stage | 20–30% | Martal Group | 2026 | Vendor benchmark |
| B2B SaaS, scale-stage | 25–35% | Martal Group | 2026 | Vendor benchmark |
| B2B SaaS median · top quartile · bottom quartile | 13–15% · 20–30% · 5–8% | RevOps Report | 2026 | Agency / community data |
| PLG: PQL → SQL | 40–60% | Martal Group | 2026 | Vendor benchmark |
| By source: demo requests · referrals · paid search · outbound | 40–60% · 30–50% · 15–25% · 5–10% | RevOps Report | 2026 | Agency / community data |
A legacy 13% / 84-day Implisit benchmark still floats around the web. Skip it. It’s from 2018, predates modern MQL gating, and was already old when most current blog posts picked it up — including most of page 1 of Google.
Now the reframe. The number you take from a row above is only directionally useful. Two teams in the same row can have wildly different MQL definitions, sales-acceptance steps, and time-to-conversion lags. The meaningful comparison is your rate to your own rate over time, holding definition constant.
When Is a "Good" MQL to SQL Conversion Rate Actually Bad?
A 50% MQL to SQL conversion rate often signals broken upstream gating, not strong marketing. Rates above 45–50% usually mean qualification is too strict — marketing is starving the top of funnel while SDRs work a pre-vetted sliver. Rates below 8% mean "MQL" is functioning as form-fill noise and SDRs are paying the audit tax.
This is the take almost no benchmark post will give you. Most pieces frame the rate as "higher is better" and stop there. They’re wrong — the rate has a healthy band, not an asymptote.
Three failure modes to recognize:
- Rate >50% with declining pipeline volume. Marketing has been pushed (or has pushed itself) into pre-qualifying so hard that SDRs are working a tiny hand-picked list. You’ll see clean handoff metrics and shrinking ARR.
- Rate <8% with high MQL volume. "MQL" probably means "form-filled." SDRs are doing marketing’s qualification work — measurable in their disqualification rate and burnout.
- Rate moving sharply month over month with no definition change. Almost always a cohort-math artifact (see the next section), not a real shift.
The healthy band most B2B SaaS teams should sit inside is roughly 12–30%, with the right number for your team depending on motion (ABM, sales-led, PLG) and definition.
Why Your Same-Month Rate Is Probably Lying (Cohort Math)
Stop dividing this month’s SQLs by this month’s MQLs. If the average MQL takes 30 or more days to become an SQL, your numerator and denominator come from different cohorts. The result looks like a real number and acts like noise — the same noise behind most year-over-year "trends" quoted in QBRs.
The fix is to lock the cohort. Pull MQLs created in month X, then track how many of those specific leads were accepted as SQLs by the end of month X + N, where N is your average conversion lag (commonly 30–90 days in B2B SaaS). HubSpot’s updated guidance lays this out plainly: if MQL→SQL takes three months in your business, compare month-three SQLs against month-one MQLs (HubSpot, updated 2025-12-26).
Two operational tips:
- Snapshot, don’t roll. Save your cohort denominator the day MQLs are created and freeze it. Rolling denominators get retro-modified when CRM hygiene work flips lead statuses backward.
- Cohort by source, not just by month. Some channels convert in 14 days; others take 90+. A blended same-month rate hides both. Cohorting by channel — and reading marketing attribution alongside it — is how you see what’s actually working.
You’ll often discover your "declining" rate is a slower-converting cohort still in flight, not a problem to solve. That’s a measurement artifact to wait out, not a fire to fight.
Why Is My MQL to SQL Conversion Rate Low?
A low MQL to SQL conversion rate traces to one of four root causes: weak source quality, mis-tuned scoring, slow handoff, or undisciplined sales acceptance. The diagnostic order matters — fixing scoring before fixing handoff is the most common wasted quarter. Walk the four stages in sequence and you’ll find the leak in the first two.
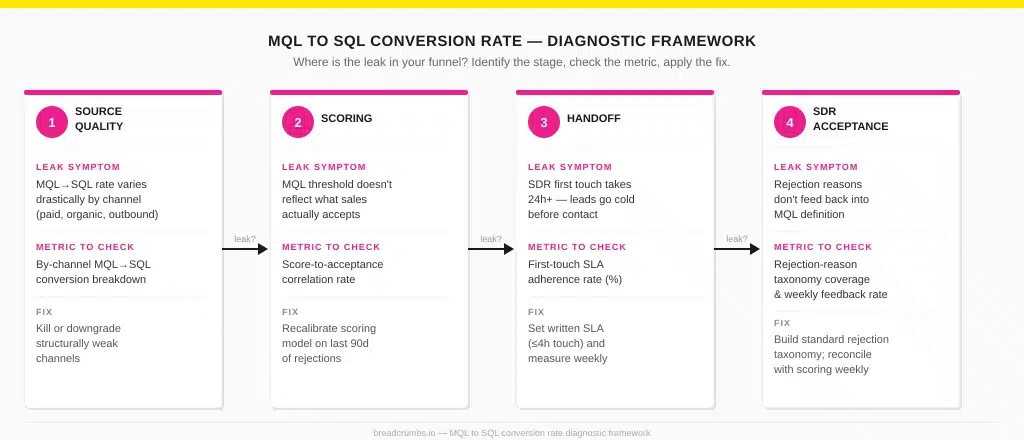
The four-stage diagnostic:
- Source quality. Pull MQL→SQL by channel. Per RevOps Report’s 2026 segmentation, demo requests convert at 40–60% while outbound runs 5–10% — orders of magnitude apart. If your blended rate looks bad, the channel mix is the first place to look.
- Scoring. Is the MQL threshold based on what sales actually accepts in the last 90 days, or a model someone built 18 months ago? If the threshold is stale, the rate will be too. (Recalibration cadence comes from lead scoring best practices, Rule 5.)
- Handoff. Speed-to-lead is brutally undervalued. If a typical MQL waits 24+ hours for first SDR touch, you’ll lose the lead before any scoring model gets a chance to be right.
- Sales acceptance. Are SDRs rejecting MQLs using a standardized taxonomy, or are reasons drifting? A live rejection taxonomy feeding back into the scoring model is what closes the loop. Without it, the rate moves randomly.
You’ll typically find the leak in the top two stages, but you can’t see it without cohorting by source and reviewing rejection reasons weekly.
How the Handoff Actually Moves the Rate
If you hold the MQL definition steady and tighten handoff speed, the conversion rate moves more than it does from any scoring re-tune. The handoff is where leads decay, and decay is the silent killer of conversion. Most "improve your MQL→SQL rate" advice on the SERP is scoring-model advice; in practice, the rate moves on handoff discipline.
Workato’s 2026 mystery-shopper study of 114 B2B companies is the cleanest current public data on this. Across that sample, more than 99% failed to respond within five minutes. Only 1 of 114 sent a personalized email inside the 5-minute window; the average personalized email response time was 11 hours 54 minutes (Workato, 2026-03-24). Even companies using lead-routing tools still averaged 3 hours 32 minutes to respond — routing alone does not fix the handoff.
LeanData’s 2025 playbook segments response SLA targets by lead type rather than applying a single threshold:
- Demo requests: under 1 minute.
- High-intent web forms: under 5 minutes.
- Trade show attendees: within 24 to 48 hours.
Source: LeanData B2B Lead Response Time Playbook (2025).
The implementation pattern that actually closes the gap is mechanical, not motivational: round-robin routing tied to a calendar with availability rules, automated meeting booking inside the form confirmation, and an exception-monitoring view that flags any high-intent lead with no SDR touch in the SLA window. If your routing tool reports compliance but your raw response time is still in hours, the routing rules are wrong somewhere — usually in the after-hours and weekend logic.
Named Case: Chargebee, 5% → 22%
Chargebee’s MQL to SQL conversion rate climbed from 5% to 22% over two years after the marketing team scrapped its catch-all acquisition model and rebuilt around an ICP-first demand engine. Shrimithran, then Sr. Manager of Marketing at Chargebee, attributed the shift to three operational changes: enrichment, de-anonymization, and account-level signal routing (Chargebee / Clearbit customer story).
The mechanics:
- Enrichment at the form. Every form submission was enriched in-flight, so the MQL threshold could be based on firmographic fit (company size, industry, tech stack), not only on form-fill engagement.
- De-anonymization on the website. Anonymous visitors with strong ICP fit were surfaced to sales as account-level signals, not lead-level scores — meaning the team could route account intent, not only individual behavior.
- Account-level routing. Instead of round-robining individual leads to SDRs, leads were routed to the SDR who already owned the account.
The point isn’t the specific vendor stack. The rate moved because the definition of MQL changed — the denominator changed because marketing redefined what counted. That’s the diagnostic working as designed.
A useful secondary case is Studytube, which reported a 46% relative increase in MQL-to-SQL conversion and a 193% increase in MQL-to-opportunity conversion from Q2 to Q4 2021, after tightening LinkedIn audience syncing through HubSpot’s native integration (HubSpot case study). Read this number carefully — Studytube disclosed relative lift, not absolute before/after rates, and relative-lift numbers are easy to flatter with small denominators.
How Do You Improve MQL to SQL Conversion Rate?
You improve the MQL to SQL conversion rate by changing what gets called an MQL and tightening what happens after it does — not by piling on scoring rules. The operational playbook below is ranked by leverage. If you only have a quarter, do the first three.
- Re-derive your MQL definition from the last 90 days of sales acceptance. If you can’t explain which behaviors and firmographics predict acceptance in your most recent 90 days, your threshold is guessing. Pull the data, run a basic logistic fit or a manual review, and rewrite the definition. This move alone typically shifts the rate 3–5 points.
- Set written handoff SLAs and measure adherence, not averages. Segment by lead type as LeanData’s playbook does — <1 min for demo requests, <5 min for high-intent forms, 24–48 hrs for trade show leads. Track SLA hit rate, not average response time. Averages hide tail failures.
- Standardize the SDR rejection taxonomy and feed it back into scoring weekly. Use no more than 6–8 rejection reasons. Pipe them into a weekly review with marketing. Rule 5 in our lead scoring best practices guide is built around exactly this — recalibrate on sales-rejection signal, every week.
- Cohort by source and kill structurally bad channels. A blended rate hides the channels eating your conversion. Read MQL→SQL alongside source-attributed pipeline (see marketing attribution) and either fix or starve channels that consistently under-convert.
- Add negative scoring. Wrong-fit titles, free-email domains, sub-threshold company sizes — score them down. Most teams add positive signals and forget the negative ones, which is why their scoring drifts loose over time. Mechanics live in our B2B lead scoring pillar.
- Run a separate PQL track if you’re PLG. Lumping product-qualified leads into the MQL bucket distorts everything. PQL→SQL is a different metric with a different healthy range (40–60% per Martal Group’s 2026 benchmark).
- Reconcile MQL and SQL counts with sales weekly. If marketing’s MQL number and sales’ "leads received" number don’t match in a weekly stand-up, you have a definitions problem disguised as a data problem. Fix it once and it stays fixed.
- Map the metric into your RevOps cadence. Weekly for handoff discipline, monthly for cohort review, quarterly as a recalibration trigger for the scoring model.
None of these moves is exotic. The reason they don’t happen is organizational, not technical — marketing and sales operate on different definitions. A working MQL→SQL operation forces them onto the same one.
How Does MQL to SQL Compare to Other Funnel Metrics?
MQL to SQL conversion rate measures marketing-sales handoff quality. SQL to opportunity rate measures sales’ ability to convert accepted leads into real deals. Opportunity to close rate measures sales execution and product-market fit. Reading them together — not any one in isolation — is how you actually locate a pipeline leak.
| Metric | What it measures | Typical B2B SaaS range | Diagnoses what |
|---|---|---|---|
| MQL → SQL | Handoff & definition alignment | 13–25% | Source quality, scoring threshold, handoff SLA, sales acceptance |
| SQL → Opportunity | SDR-to-AE conversion | 30–50% | SDR qualification depth, AE discovery quality |
| Opportunity → Close | Sales execution & PMF | 20–30% (wide variance) | Sales motion, pricing fit, competitive position |
| MQL → Opportunity (blended) | End-to-end marketing contribution | 5–12% | Marketing-sourced pipeline efficiency |
The shortcut: if your MQL→SQL rate is healthy but your Opportunity→Close rate is bad, the leak is sales, not marketing. Don’t fix the scoring model.
For ABM-led teams, the lead-level math is increasingly less informative. RevOps Report notes that mature ABM organizations are shifting toward buying-group qualification — the lead becomes a signal inside an account, not the unit of measurement (RevOps Report, 2026-04-02). If you’re running an account-led motion, track account-to-opportunity rate as your primary metric and keep MQL→SQL as a secondary diagnostic for the inbound channel only.
How Often Should You Review MQL to SQL Conversion Rate?
Review the MQL to SQL conversion rate on three cadences: weekly for handoff discipline, monthly for cohort analysis, quarterly as a recalibration trigger for the scoring model. Each cadence answers a different question and uses a different cut of the data. Mixing them up is how teams overreact to noise or under-react to drift.
- Weekly. Are SDRs accepting MQLs within SLA? Are rejection reasons clustering on a new pattern? This is operational hygiene, not benchmark-checking.
- Monthly cohort. What did the MQLs created last month actually convert to? Cohort by source. This is where real signal lives.
- Quarterly recalibration. Does the scoring threshold still match the last 90 days of sales-accepted behavior? This is where you reset the definition — see Rule 5 of our lead scoring best practices.
If you’re only looking at the rate during a QBR, you’ll miss every handoff problem and over-index on cohort noise. Weekly is the right operational tempo.
Key Takeaways
- The MQL to SQL conversion rate is a diagnostic, not a target. Two teams with identical pipelines can report wildly different rates based on definition alone.
- The healthy band is roughly 12–30% for B2B SaaS. Above 45–50% usually signals over-restrictive gating; below 8% usually signals form-fill noise.
- Cohort the math. Same-month rates lie when conversion lag is 30–90 days. Lock the denominator to MQLs created in period X.
- The handoff is where the rate moves. Workato found >99% of B2B companies miss the 5-minute mark and routing-tool users still averaged 3h 32m. Tighten SLAs before re-tuning the scoring model.
- Definitions move with sales acceptance. Re-derive your MQL threshold every quarter from the last 90 days of acceptance data — Rule 5 in lead scoring best practices.
If you’re rebuilding the metric stack underneath the MQL handoff, our B2B lead scoring guide is the pillar and MQL vs SQL is the definitional sibling. Read both alongside this one, and your team will stop arguing about benchmark numbers and start arguing about definitions — which is the argument worth having.