
By the Breadcrumbs Editorial Team — Last updated 2026-05-07
The fastest way to break a B2B marketing program is to pick one attribution model and trust it. Marketing attribution is now a triangulation problem — algorithmic multi-touch tells you the trend, self-reported attribution tells you the truth buyers remember, and marketing mix modeling tells you what budget to defend at the next QBR. None of those signals is right alone. The job is not eliminating the discrepancy between them; it is sizing the error band you can live with for the decision in front of you, then operating inside it.
What Is Marketing Attribution?
Marketing attribution is the practice of assigning credit for revenue or pipeline to the marketing touchpoints that contributed to it. RevOps teams use it to allocate budget, defend channel investment, forecast pipeline, and reconcile what marketing claims with what the CRM books as sourced. It is signal allocation, not causal proof.
The reason it is harder than it looks in B2B is buyer behavior, not tooling. 6sense’s 2025 Buyer Experience Report — surveying nearly 4,000 B2B buyers — found buyers initiate first contact with vendors 79% of the time, 94% of buying groups rank their shortlist before sales engages, and the first vendor conversation is with the eventual winner in 77% of cases. McKinsey’s 2024 B2B Pulse puts the average buyer across 10 channels, with 42% using more than 11.
If most of the buying journey happens before a tracked click, the model picking up that click is reporting on the last few feet of a road that started miles back.
The Six Attribution Models (And Where Each One Breaks)
Six attribution models dominate B2B reporting: first-touch, last-touch, linear, time-decay, U-shaped (position-based), and W-shaped. Plus a seventh data-driven/algorithmic class. Each one credits touchpoints differently, each one was designed for a different decision, and each one fails predictably when forced to do work it was not built for.
| Model | How it credits | Best decision it informs | Where it fails alone |
|---|---|---|---|
| First-touch | 100% credit to the first known touch | Top-of-funnel demand sourcing | Misses everything that converted the buyer; rewards the channel that sees them first regardless of impact |
| Last-touch | 100% credit to the final touch before conversion | Lower-funnel/closer attribution | Undercredits brand, content, and dark social; over-credits direct/branded search |
| Linear | Equal credit across every touch | Long-cycle journey visibility | Treats a webinar attended once as equal to ten product page visits |
| Time-decay | More credit to touches closer to conversion | Cycles where recency matters | Penalizes early-funnel education that built the shortlist months out |
| U-shaped (position-based) | 40/40 to first and last touch, 20% spread across middle | Lead-creation programs | Encodes a guess about which touches mattered most |
| W-shaped | 30/30/30 to first, lead, opportunity stages, 10% spread elsewhere | B2B opportunity-creation reporting | Requires clean stage tagging across CRM and MAP — most teams do not have it |
| Data-driven / algorithmic | Model-assigned weights from historical conversion patterns | Tactical campaign optimization | Needs volume, identity resolution, and clean UTM/CRM linkage; not causal proof |
First-touch
First-touch credits the channel that introduced the account. It is useful for sourcing reports — which campaign opened the door — and useless for the question of what closed the deal. 6sense’s 2025 data shows the average B2B buyer has been involved in 8.6 prior purchase journeys in the same category. "First touch" often reflects years of category memory, not a campaign you can replicate.
Last-touch
Last-touch is the model that survives in dashboards because it is easy to compute and easy to defend. It is also the model that quietly kills brand investment. EMARKETER and Snap surveyed 282 US marketers in mid-2024 and found only 21.5% were confident last-click attribution reasonably reflected a platform’s long-term business impact. Use it for "what converted now," not for "what to fund next quarter."
Linear
Linear gives every touch equal weight. It is honest about its ignorance — it does not pretend to know which touch mattered — and that is also why it is rarely useful for decisions. Linear works as a journey-visibility view, not a budget tool. If the team is using linear to allocate spend, the team is allocating spend by accident.
Time-decay
Time-decay tilts credit toward recent touches. It is reasonable for short transactional cycles. It punishes brand and category education in long enterprise cycles, where the deck was stacked nine months before the closing demo. Pair it with a longer lookback window than the default, or replace it.
U-shaped (position-based)
U-shaped (also called position-based) gives 40% to first touch, 40% to last, and spreads 20% across the middle. It is a useful default for lead-creation reporting in mid-market B2B. It is still a guess — a structured one, but a guess — about which touches deserve credit. Treat the weights as an editorial choice, not an analytical truth.
W-shaped
W-shaped credits first touch, lead conversion, and opportunity creation. On paper, it is the most B2B-aware of the rule-based models. In practice, it requires clean stage tagging across CRM and marketing automation that most teams have not built. Without that data hygiene, W-shaped reports look authoritative and mean nothing.
Data-driven / algorithmic (multi-touch)
Algorithmic multi-touch attribution (MTA) lets a model assign weights from historical patterns. It works when identity resolution, UTMs, and opportunity contact roles are clean — and it is operational visibility, not causal proof. A widely-cited practitioner critique frames the result as an "attribution mirage" — companies appearing data-driven while actually being led by the channels easiest to track. GA4 underscored this in November 2023 when it removed first-click, linear, time-decay, and position-based models, leaving most teams with last-click and data-driven views unless they export the raw data.
Single-Touch vs Multi-Touch Attribution: Which Should You Run?
Single-touch attribution credits one touch — first or last. Multi-touch spreads credit across the journey. The right call is not which one is more accurate; it is which model has an error band you can live with for the decision in front of you. Pick the cheaper, simpler signal until pipeline complexity forces the upgrade.
For most B2B teams under 100 employees, multi-touch attribution is a trap. MTA’s accuracy depends on volume, identity resolution, and stage hygiene that small teams do not have. Without enough closed-won data to train against, an MTA model is a confident-looking random number generator. Run last-touch plus self-reported, reconcile monthly, and revisit the question once pipeline volume justifies the build.
For larger teams with disciplined CRM operations, MTA is worth running — but as one of three signals, not as truth. HockeyStack’s analysis of 150 B2B SaaS companies ($8M–$2B ARR) found closed-won opportunities averaged 266 touchpoints and 2,879 impressions, up 19.8% in touchpoints since 2023. Any model that has to weight 266 touchpoints into a pipeline forecast is making a lot of guesses. The discipline is reading those guesses as a trend line, not as a credit assignment.
The deeper reframe: cross-platform discrepancies are not a bug to chase to zero. They are a feature to size. Decide what error percentage is acceptable per channel — 15%, 25%, 40% depending on signal quality — and only investigate variance that exceeds the threshold. Reconciling Google Ads, LinkedIn, the CRM, and the MAP every month into a single number is a project that consumes one analyst forever and improves no decision.
Self-Reported Attribution: The Signal Vendors Don’t Sell You
Self-reported attribution (SRA) — the "How did you hear about us?" field on a demo form — is now a primary signal for mature B2B SaaS teams, not a vanity metric. It captures dark social, podcasts, community recommendations, and AI-assisted discovery — channels with no tracked click. Used well, it is the closest signal to what the buyer actually remembers.
It is also messy. HockeyStack’s 2024 SRA Report analyzed 8,528 self-reported responses and found roughly 20% were invalid or unusable — typos, generic answers, or fields filled to clear the form. The fix is operational, not philosophical: structured options for the dominant channels, an open field for everything else, and a monthly reconciliation pass that maps free text into the structured taxonomy.
The most important number in that HockeyStack dataset is the overlap with last-touch. SRA matched last-touch only 2.5% of the time on display, 21% on email, 53% on search, and 60% on social. In other words: a large share of what buyers remember as their source of discovery is invisible to platform attribution — and on display and email it is almost completely invisible. Treating those as the same signal silently kills brand, content, and community channels.
How to operate it:
- Form placement. Demand demos and sales-qualified inbound forms only. Do not put SRA on top-of-funnel content gates — the answer is "Google" 80% of the time and the data is noise.
- CRM field. Single source of truth, structured options plus open-text. Synced to the opportunity, not just the lead.
- Monthly synthesis. RevOps reconciles SRA against last-touch and platform data. Where they disagree, the disagreement is the report.
Marketing Mix Modeling and Incrementality Testing
Marketing Mix Modeling (MMM) and incrementality testing measure aggregate channel impact and causal lift, not individual touchpoint credit. MMM uses statistical regression on historical spend, outcomes, and external factors to estimate channel contribution. Incrementality tests — geo holdouts, audience holdouts, A/B exposure — isolate the lift a channel actually produced. Together they are the budget-defense layer.
Use MMM and incrementality where touch-level attribution structurally fails: brand search, paid social impressions, connected TV, podcast, and any channel where impressions matter more than clicks. Adobe’s 2024 cookie deprecation study found 49% of brands still depend on third-party cookies for measurement, but only 60% feel prepared for signal loss, and more than one in three say cookie deprecation has already hurt their ability to track and measure. The IAB’s State of Data 2024 survey put 95% of brands, agencies, and publishers expecting continued signal loss. MTA-only stacks were degrading before any of that, and they are now structurally insufficient.
A practical example: Paycor’s CTV program, as published by Monks, pairs incrementality testing with lower-funnel CRM metrics to connect MQLs and bookings to CTV investment. Last-touch would have killed that channel; incrementality justified scaling it.
A technical reference example outside B2B: Lemonade — a public online insurance company — published a 2025 paper on Bayesian MMM combining marketing activity, performance data, seasonality, market trends, and macroeconomic indicators, validated against A/B holdout data. The technique is portable; the consumer context is not.
The lightweight MMM stack does not require a six-figure consulting engagement. Meta’s open-source Robyn and Google’s Meridian put MMM in reach of any team with an analyst and 18+ months of clean spend and outcome data. Below that data threshold, MMM produces confident-looking nonsense.
The Triangulation Framework
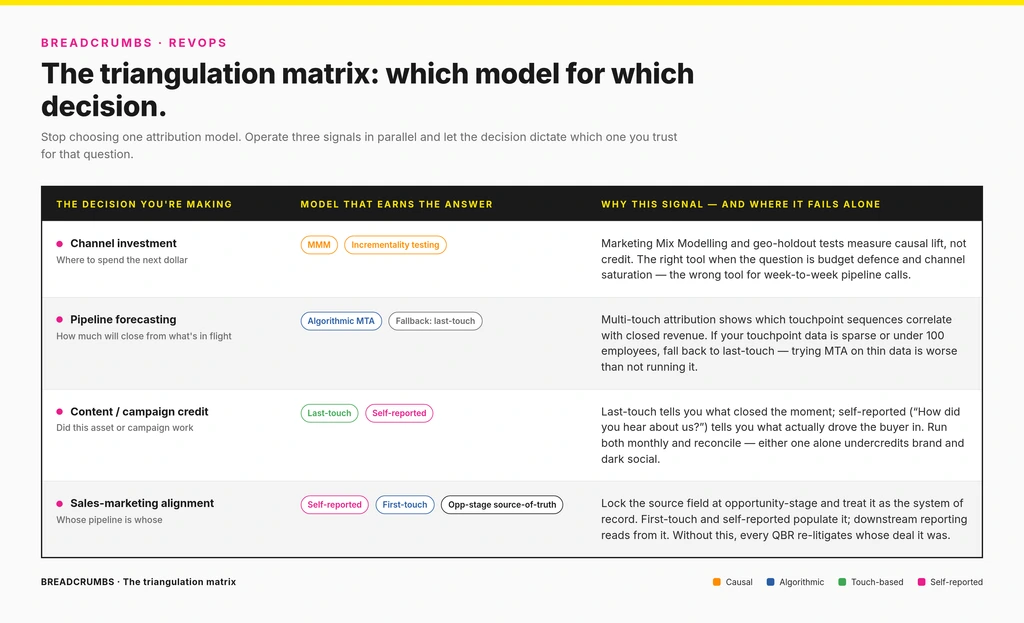
Triangulation means running three signals against the same decision and reading them together: algorithmic MTA for trend, self-reported attribution for what buyers remember, and MMM/incrementality for causal channel impact. The point is not to reconcile them into one number — it is to pick the right primary signal for each decision and use the others as a sanity check.
The reason this framework matters more in 2026 than it did in 2022 is the un-attributable channel mix has gotten too large to ignore. AI-generated search answers shorten the path to a vendor without sending a click — Bain’s 2025 zero-click research reports B2B click-through rates falling by as much as 30% in some categories. A June 2025 arXiv study of ~14,000 search-enabled LLM conversations found Gemini provided no clickable citation source in 92% of answers. Dark social — Slack groups, podcasts, internal forwards — was already invisible to MTA; the combined effect is that any model depending on a tracked click is reporting on a shrinking minority of the journey.
| Decision | Primary signal | Supporting signal | Why it fails alone |
|---|---|---|---|
| Weekly campaign optimization | Algorithmic MTA / data-driven (where identity and CRM data are clean) | Last-touch + UTM-level rollups | MTA is operational, not causal; treats correlation as credit |
| Quarterly budget allocation | MMM + incrementality tests | MTA trend lines | Touch-level models undercredit brand and zero-click channels and over-credit branded search |
| Content & campaign credit | Last-touch + self-reported attribution | Assisted-touch reporting | Last-touch alone misses 40% of social and 47% of search discovery in HockeyStack’s SRA overlap data |
| Sales-marketing alignment | Opportunity source-of-truth (self-reported + first-touch) | CRM stage data, contact-role weighting | Contact-level models ignore buying committee reality |
| Board / CFO reporting | Blended CAC payback, sourced/influenced pipeline definitions | MMM/incrementality + CRM close rates | Platform ROAS is not company ROI; mixing them invites a budget cut |
The matrix is the discipline. Every attribution debate inside RevOps should start with "what decision does this number have to make?" and pick the signal accordingly. The model question follows the decision question, not the other way around. This is also where the framework connects back to the broader revenue operations charter: attribution is a RevOps function because it is a decision-input function, not a marketing-reporting function.
Marketing Attribution Metrics That Actually Matter
The metrics that survive contact with a board meeting are blended, comparative, and bounded. CAC payback, marketing-sourced vs marketing-influenced pipeline, channel ROI within a defined attribution window, and pipeline velocity by source. Each one pairs with a specific signal type. The mistake is reporting any of them without naming the model that produced them.
- CAC payback, sliced by source. Pairs with MMM/incrementality at the channel level. Single-touch models distort CAC by undercrediting brand and overcrediting paid search.
- Marketing-sourced vs marketing-influenced pipeline. Two distinct numbers, not interchangeable. Sourced uses opportunity-stage source-of-truth (typically self-reported + first-touch). Influenced uses any-touch reporting. Reporting influenced as if it were sourced is the single most common attribution lie in B2B.
- Channel ROI within a defined window. Lookback windows are an editorial choice, not a fact. Pick a window per channel — short for paid search, longer for content and brand — and report the window alongside the number.
- Pipeline velocity by source. Time from MQL to closed-won, segmented by attributed source. Paired with the MQL vs SQL handoff it surfaces which sources produce pipeline that actually closes vs pipeline that stalls.
- Touch-to-opportunity ratio per channel. A complement to MTA; useful for diagnosing channels where high touch volume disguises weak conversion. See the sales and marketing performance metrics framework for how this connects to broader pipeline measurement.
Every metric on that list is a derived number. The signal that produced it is the report.
Common Mistakes RevOps Teams Make With Attribution
The same five or six failures show up every time an attribution program loses credibility. None of them are tooling problems. All of them are framing problems — running the wrong signal against the wrong decision and being surprised when the answer is wrong.
- Treating MTA output as causal truth. MTA describes credit allocation. It does not prove a channel caused revenue. Pair MTA with incrementality testing on any channel meaningful enough to defend at a budget review.
- Killing channels on bad data. Deactivating brand or community investment because last-touch undercredits them is the most expensive attribution mistake in B2B. The HockeyStack overlap data shows last-touch agrees with self-reported attribution only 60% of the time on social and 2.5% on display — if last-touch is the only signal, brand looks unprofitable when it is not.
- Not reconciling CRM source against platform attribution monthly. Platform attribution lives in the channel tools. Self-reported and first-touch live in the CRM. They will disagree. Monthly reconciliation, owned by RevOps and shared with the marketing-sales alignment review, is the only way to keep both honest.
- Treating cross-platform discrepancies as a bug to eliminate. Discrepancy is structural. Define an acceptable error percentage per channel, document it, and only investigate variance that exceeds the threshold. Chasing 100% reconciliation between Google Ads, LinkedIn, and the CRM consumes analyst time and improves no decision.
- Reporting marketing-influenced as if it were marketing-sourced. Influenced pipeline is a much bigger number. Sourced is the harder number to defend and the one CFOs trust. Mixing them once tanks the credibility of the function for a year.
- Letting attribution debates stall budget reviews. Decide the model and the lookback window before the QBR, not during it. The triangulation framework exists so the budget conversation can be about budget, not about whose dashboard is right.
The thread through all six: attribution is a decision input. It is not the decision. Teams that treat it as the decision get over-obsessed with eliminating discrepancies and never get to the question the discrepancies were supposed to inform. Run the signals, size the error, make the call.
For RevOps teams operating attribution alongside lead scoring, the same framing applies: signal triangulation beats single-source confidence. See the B2B lead scoring framework for how attribution data feeds back into scoring inputs at the account and opportunity level.
Key Takeaways
- Marketing attribution is a triangulation problem, not a model-selection problem. Algorithmic MTA, self-reported attribution, and MMM/incrementality each measure something the others cannot — and each fails predictably alone.
- Pick the model whose error band you can live with for the decision in front of you. Discrepancy between platforms is structural. The work is sizing the acceptable error per channel, not eliminating it.
- Self-reported attribution is now a primary signal, not a vanity metric. It is the only data layer that captures dark social, AI-search referrals, and pre-contact research — the channels that an increasing share of B2B journeys runs through.
- MMM and incrementality testing are the budget-defense layer. Touch-level models structurally undercredit brand, content, and zero-click channels. Defending those investments requires aggregate causal measurement, not better cookies.
- The right organizing question is not "which attribution model is best?" It is "what decision am I making, and which imperfect signal is reliable enough for that decision?" The model follows from the decision.
Where to go next
Attribution is a RevOps function because it is a decision input — and the same triangulation discipline applies to lead scoring, pipeline reporting, and marketing-sales handoff design. The revenue operations pillar is the place to start if the next conversation in the org is about how all three fit together.