Most B2B lead scoring models silently stop predicting conversion within six months of launch. Dashboards keep producing numbers, sales keeps complaining the leads are bad, and nobody runs the test that proves the model is decoration rather than signal.
This guide is the operational counterpart to the b2b lead scoring framework — the day-to-day rules that keep a model alive after launch. Twelve rules, grouped into foundations, operations, and edge cases. Each comes with the failure mode that breaks it and the move that fixes it.
How to Use These 12 Lead Scoring Best Practices
Read Foundations before setting a single point value. Use Operations rules in your weekly RevOps standup — those are the ones teams skip and then wonder why the model rots. Edge Cases cover failure modes that don't appear in vendor docs but kill scoring programs in production. If you've inherited a model nobody trusts, jump to Rule 4 first.
Foundations: Get the Model Right
Foundations cover what the model measures and how it weights signals. Get these wrong and no amount of operational hygiene will save you — you'll be recalibrating decoration. Score fit and intent on separate axes, derive the MQL threshold from your own sales-acceptance data, and treat negative scoring as a hard requirement, not an optional layer.
Rule 1 — Score Fit and Intent Separately, Then Combine
A single composite score hides why a lead is hot — and forces sales to guess whether they're chasing a great-fit account that just opened a demo email or a tire-kicker refreshing your pricing page.
Two-axis scoring is the practitioner standard. MadKudu splits it into Customer Fit and Likelihood to Buy; predictive vendors use grade-plus-score; the lead scoring model approach walks the math. A 75 from an A-fit account at demo stage is not the same lead as a 75 from a D-fit account browsing the careers page.
Why teams break this: A single composite is easier to display in a CRM card, easier to filter, and easier to explain to a CEO who wants "leads above 80." Most CRM-native scoring defaults to additive single-axis math because that's what fits in one column.
What to do instead: Maintain two scores — a fit grade (A/B/C/D from firmographics and ICP match) and an intent score (0–100 from behavior). Route on the matrix, not the sum. A-fit with 60 intent is sales-ready; C-fit with 90 intent is content-ready, not sales-ready.
Rule 2 — Set Your MQL Threshold from Sales-Acceptance Data, Not "Industry Average"
The MQL threshold is the most consequential number in your model — and the one most teams pick by gut, vendor template, or political compromise.
There is no industry-standard MQL threshold. Vendor claims that "MQLs capture the top 20%" or "50–75 on a 100-point scale" are positioning, not data. The threshold that matters sits where sales acceptance rate breaks — between the band that converts to opportunity at meaningful multiples of baseline and the band reps start ignoring.
Why teams break this: The threshold gets locked in at launch, before any sales-acceptance data exists. The team picks a round number, sales ignores leads below it, and nobody revisits the cutoff once funnel data lands.
What to do instead: After 60 days of scored leads, bucket them by score band (0–20, 21–40, 41–60, 61–80, 81–100) and chart sales acceptance rate plus opportunity conversion per band. Set MQL where the curve breaks. Document the cutoffs so the next person to inherit the model can re-derive them. The MQL vs SQL handoff guide covers the acceptance-rate definitions that make this comparison clean.
Rule 3 — Treat Negative Scoring as Non-Negotiable
Most scoring models qualify leads aggressively and disqualify them lazily — the result is an MQL queue that's 30–40% noise the rep has to filter manually.
Negative scoring is the difference between a model that protects rep time and one that just sorts the noise. Every working model subtracts points (or hard-disqualifies) across at least eight signal categories: personal email domains, role mismatch, company-size mismatch, geography, competitor employees, job seekers, students, and unsubscribed contacts.
Why teams break this: Negative signals are politically uncomfortable — nobody wants to hard-disqualify "potential" leads. So the penalty becomes -2 instead of -20, the signals stay in the MQL band, and the rule does nothing.
What to do instead: Make negative weights large enough to actually pull leads out of MQL — half-measures don't filter. Use the table below as a starting list, then validate each penalty against your own rejected-lead history. The scoring criteria deep dive covers signal selection in more detail.
| Negative signal | Why it matters | Action |
|---|---|---|
Personal email domain (gmail.com, yahoo.com) |
B2B buyers use work email; consumer domains predict consumer intent | -15 to -25, or route to nurture |
| Role mismatch (interns, students, ICs when buyers are VP+) | Historical deals show buyer role; mismatch burns rep cycles | Hard disqualify or -30 |
| Company-size mismatch (outside ICP bands) | Pricing and sales motion don't fit either tail | -20 to -40 |
| Competitor employee | No purchase intent; intel risk | Hard suppress |
| Job seeker signals (careers page, "looking for opportunities") | Common high-volume false positive | -15 and remove from MQL |
| Out-of-territory geography | Operational or legal inability to serve | Hard disqualify |
| Unsubscribed / opted out | No active nurture path | Remove from scoring |
| Stale activity (no engagement 60–90 days) | Past intent decayed (see Rule 6) | Time-decay points toward zero |
Operations: Keep the Model Alive
Operations is where most scoring programs quietly die. The model launches, the team moves on, and six months later nobody can tell whether the score still predicts anything. The five rules below are the operating loop — measure lift, recalibrate on signal, handle decay correctly, document allocations, and close the sales feedback loop fast enough that the model learns.
Rule 4 — Measure Score-to-Conversion Lift Monthly
If your scoring model isn't beating no-scoring at predicting opportunity conversion, it's decoration — and you'd never know unless you measured.
Lift is the only number that tells you whether the model is doing its job. Calculate it monthly. The formula:
score lift = conversion rate of top-score band / conversion rate of unscored baseline
A working model lands between 3x and 10x. At 1.5x, the model is barely separating signal from noise. At 1.0x, it's expensive routing.
Why teams break this: Lift requires a counterfactual — what would have converted without scoring — and counterfactuals are uncomfortable. So teams measure score velocity, MQL volume, or average score instead. All three can move while real predictive power collapses.
What to do instead: Hold out 5–10% of leads as unscored control if your CRM allows it, or use historical pre-scoring conversion rates as the baseline. Track the ratio monthly. When lift drops two months running, treat it as a recalibration trigger (Rule 5). Thinkific reported 2x MQL-to-opportunity rate within three months of rebuilding scoring — they could prove the lift because they measured against a baseline.
Rule 5 — Recalibrate on Sales-Rejection Signal, Not the Calendar
"Recalibrate quarterly" is the most common scoring advice on the internet and the least useful — it catches slow drift and misses acute failure.
The right rule combines a calendar floor with a signal trigger. The calendar catches slow ICP drift; the signal catches sudden divergence between what the model predicts and what sales actually accepts. Use both — the signal trigger is what saves you between quarterly reviews.
Why teams break this: Calendar reviews are easy to put on a recurring meeting. Signal triggers require instrumentation — tracking rejection rate by score band and noticing when it moves. That's an extra dashboard nobody owns by default.
What to do instead: Set a baseline rejection rate (sales-rejected MQLs / total MQLs) per score band. If any band moves more than 10 percentage points in a 4-week window, trigger a recalibration — treat this 10pp move as your team's operating trigger, not as an industry benchmark. Also recalibrate before any meaningful change to ICP, pricing, region, or sales motion. Predictive models trained on the old funnel will quietly mis-rank leads from the new one (Frontiers in Artificial Intelligence, 2025, doi:10.3389/frai.2025.1541983).
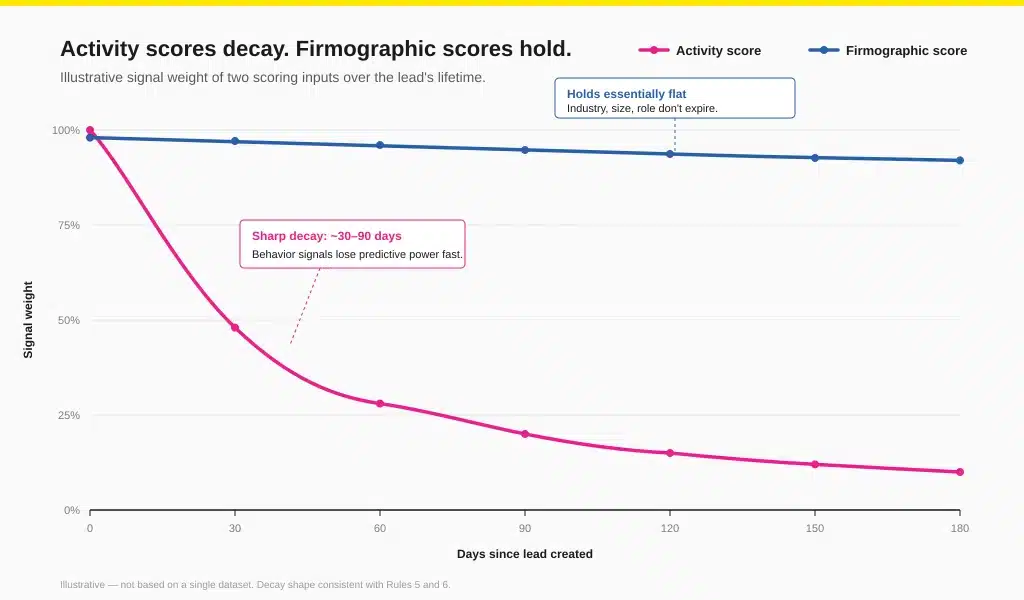
Rule 6 — Decay Activity Scores; Refresh Firmographic Scores
The half-life of a pricing-page visit is two weeks. The half-life of "VP of Marketing at a 200-person SaaS" is two years. Treating them with the same decay logic breaks the model in opposite directions.
Activity is intent expiring in real time — a whitepaper download from 90 days ago is not the same signal as one from yesterday. Firmographic data is identity — it doesn't decay; it gets stale. Decay one, refresh the other. HubSpot supports timed score decay natively, and most mature scoring tools follow the same pattern.
Why teams break this: Decay logic is fiddly to configure and easy to skip. Most CRM-native setups treat every point as permanent until manually reset, so a lead who engaged once 18 months ago looks identical to one who engaged this morning.
What to do instead: Set decay windows by signal type — page visits and email opens decay to zero over 30–60 days; demo requests and trial signups over 90–180 days. Firmographic fit doesn't decay; it gets refreshed through enrichment when accounts change size, industry, or stack. The model approach guide shows the decay-versus-refresh split in more detail.
Rule 7 — Document the Rationale for Every Point Allocation
Undocumented scoring models can't be debugged — and every model becomes undocumented within two quarters if the team doesn't write it down on day one.
Score allocations are decisions: "Pricing-page visit = +15." Without the reasoning, the next person to touch the model can't tell whether to change it. They either inherit your mystery or rip the whole thing out.
Why teams break this: Documentation feels like overhead at launch. The team is busy shipping v1, the rationale lives in someone's head, and three months later that person is on a different project or at a different company.
What to do instead: Maintain a single scoring spec — a Notion page or row-per-signal spreadsheet — with signal, weight, source, rationale, and last-changed date for every point allocation. Update it on every model change. The native UI in tools like HubSpot's lead scoring shows the weights but rarely the why; the spec is where the why lives.
Rule 8 — Close the Sales Feedback Loop Within a Week
A scoring model that learns from sales feedback once a quarter is two months behind reality at any given moment — and most teams aren't even closing the loop that fast.
Fast-improving models capture rejection reasons at the rep level and feed them into adjustments within the same week. Slow loops compound: by the time the team learns a signal is misfiring, the model has already mis-routed weeks of leads, and the rep trust deficit takes a quarter to undo.
Why teams break this: Rejection reasons live in CRM free-text fields if they exist at all. Marketing doesn't see them, RevOps doesn't aggregate them, and sales stops writing them once it's clear nothing changes.
What to do instead: Enforce a structured rejection-reason field with a short controlled vocabulary (fit, timing, role mismatch, duplicate, bad contact, other). Review weekly in the RevOps standup. Adjust point allocations the same week when a rejection pattern is clear. Tell sales when the adjustment lands — the loop only works if reps see their feedback move the model.
Edge Cases: Where Most Lead Scoring Models Fail
Edge cases are the rules that aren't in vendor documentation because they don't sell software. They show up after the model has been live long enough to break — when PLG signals pollute MQL scoring, form fills inflate against intent, predictive was turned on too early, or the v2 launch finally becomes unavoidable.
Rule 9 — Give PLG Signals Their Own Scoring Track
Product usage and PQLs are different signals from marketing engagement — bolting them onto a classic MQL model corrupts both.
A product-qualified lead hitting activation thresholds is a different motion from a marketing-qualified lead downloading a whitepaper. PQL routing goes to product-led specialists or expansion AEs; MQL routing goes to demand-gen AEs. If both feed one composite score, you lose the routing distinction and the playbook collapses into "call them all."
Why teams break this: PLG is often the second motion grafted onto a sales-led company. The scoring model already exists, so adding product-usage signals to it is faster than building a separate track. The resulting score predicts neither motion cleanly.
What to do instead: Run two parallel tracks with explicit thresholds and routing for each. Share the firmographic fit grade across both. Keep behavior signals separate — marketing engagement on one axis, product usage on the other. Calculate lift (Rule 4) for each track independently.
Rule 10 — Don't Score Form Fills Alone
Form submissions are the most gameable behavior signal you have — and the easiest to over-weight because they're easy to track.
Anyone can fill a form. The signal isn't the submission; it's what came before and after. A demo request from someone with three pricing-page visits is a different lead from a demo request that's the only event in the session. Weighting form fills in isolation rewards bots, competitor recon, and researchers more than actual buyers.
Why teams break this: Forms are convenient — easy to fire, attribute, and display in a dashboard. So they end up over-weighted relative to harder-to-track signals like return visits, content depth, or product usage.
What to do instead: Score form fills in context. Require an accompanying behavior pattern — minimum session depth, multi-page visit, return visit within 30 days — before the fill contributes full points. Always pair form fills with negative scoring (Rule 3): a form fill from a personal-email-domain student is a -10, not a +20.
Rule 11 — Predictive Scoring Needs Clean, Recent Labeled History; Vendor Minimums Are Eligibility Floors, Not Accuracy Guarantees
Predictive tools have low public minimums — the moment your data passes them, the UI lets you flip the model on. Eligibility is not the same as reliability, and most predictive models that disappoint were turned on at the floor.
A predictive model is a function of its training data. Vendor minimums are the volume at which the algorithm can produce a model, not a useful one. If your won/lost history is small, stale, imbalanced, or drawn from a pre-pivot ICP, the model ranks leads against the wrong target.
Why teams break this: Vendor onboarding nudges you toward turning predictive on as soon as the UI permits it. The tool says "ready"; nobody asks whether the data is.
What to do instead: Before enabling predictive, validate that you have at least 12 months of clean, current-ICP labeled history with consistent disposition reasons. If you don't, run rules-based and revisit predictive when the data is mature.
| Vendor | Public minimum | What it proves | What it does not prove |
|---|---|---|---|
| HubSpot AI scoring | 25 converted + 25 non-converted contacts | The tool will let you turn it on | That the model beats rules-based at your volume |
| Microsoft Dynamics predictive | 40 qualified + 40 disqualified leads in your chosen training window (3 months to 2 years) | Algorithm can train and publish | That training data represents your current ICP, motion, or pricing |
The contrarian read: if your team can't show clean won/lost history by segment, rules-based will be easier to debug than predictive — even if the tool technically lets you turn it on.
Rule 12 — Plan for v2 in Your Launch Checklist
Every scoring model is wrong the day you ship it. The teams that ship working models are the ones who planned for v2 before v1 went live.
A v1 model is an informed guess — at weights, thresholds, decay windows, which negative signals would matter. Real funnel data will tell you which guesses were wrong inside 60 days. Durable scoring programs treat v1 as a starting position and book the v2 review before v1 ships.
Why teams break this: Launching scoring is exhausting — politics, alignment, training, integration. The team ships v1 and treats it as the destination. Three months later, half the weights are off, but the team has moved on.
What to do instead: Add the v2 review to the launch plan. Book it 60 days post-launch, with owners and inputs: 60 days of acceptance data, rejection reasons, and score-to-conversion lift (Rule 4), plus the recalibration triggers from Rule 5. Most working scoring models run on v4 or v5 — the difference is whether the team is on a version cadence or in permanent firefighting.
Real-World Lead Scoring Examples
The most useful named examples aren't textbook "we built a 100-point model" stories — they're the SaaS teams that connected real funnel data into scoring, measured lift, and reported the number publicly. Two below: one rules-and-engagement-led, one intent-and-account-led. Both prove the same principle from opposite ends of the spectrum.
Thinkific — Fit + Engagement Across Four Data Sources
Thinkific, the online-course SaaS platform, connected HubSpot, Salesforce, website behavior, and product activity into a single scoring model. Fit came from job title and industry; engagement came from page views, time on page, and product activity. Reported outcome: 2x MQL-to-opportunity rate in three months. Rules validated: 1 (fit and intent on separate axes), 4 (measure lift against a baseline), and 9 (product usage as a distinct signal class). (Disclosure: Thinkific ran on Breadcrumbs' platform at the time. Treat the structure as transferable, not the implementation.)
Ceros — Predictive Account Prioritization at ABM Scale
Ceros, the interactive-content SaaS, had SDRs each carrying 300–400 target accounts — too many for manual prioritization. They moved to intent-driven account prioritization with 6sense, focusing rep effort daily on 10–20 accounts in Decision or Purchase stage. Reported outcomes over six months: 450 new opportunities, 72% lift in meeting-to-SQL rate, 22% increase in average deal size, 109% increase in win rate, 118% increase in opportunities (Source: 6sense Ceros case study). This is account prioritization rather than classic MQL scoring, but it validates the same rules — 4 (lift is the proof metric), 9 (account/intent signals need their own track), and 11 (predictive works when the underlying data and motion are mature).
Common Mistakes That Violate These Rules
Most broken scoring models fail the same way — not from one bad decision but from a cluster of rules skipped together. Four patterns recur across scoring audits, each violating multiple rules at once. If two or more sound familiar, the model is closer to decoration than signal.
- The single-number score with no fit/intent split (Rules 1, 9). PLG and MQL signals mix into one composite; routing rules become political instead of evidence-based.
- The threshold that's never been re-derived (Rules 2, 4, 5). MQL cutoff was set at launch from a vendor template; nobody has charted acceptance rate by score band since.
- Positive scoring carefully tuned, negative scoring rubber-stamped (Rules 3, 10). Form fills give +20; students, competitors, and personal-email submissions give -2 if anything. The MQL queue is 30–40% noise.
- No documented rationale and no v2 cadence (Rules 7, 12). Nobody can explain why "demo request = +25." The original builder is gone, and the team is afraid to touch the model.
Key Takeaways: The Five Rules With the Biggest Leverage
If you can only adopt some of these rules, start here. These five move a model from decoration to signal fastest — and their absence is the strongest predictor of a scoring program quietly dying inside year one.
- Score fit and intent separately (Rule 1). Single-number scoring hides the routing decision that matters.
- Derive the MQL threshold from your own data (Rule 2). Vendor templates are positioning; acceptance-rate curves are evidence.
- Measure score-to-conversion lift monthly (Rule 4). If the top band isn't beating the no-scoring baseline, it's routing decoration.
- Recalibrate on rejection signal, not the calendar (Rule 5). Quarterly catches drift; a 10pp rejection-rate move catches acute failure.
- Plan v2 before v1 ships (Rule 12). Every working scoring model is on v4 or v5 — the teams that get there booked the version cadence before the launch retro was over.
The framework behind these rules — the four scoring inputs, the decision matrix, the rules-vs-predictive choice — lives in the b2b lead scoring pillar. Read that next if you're building from zero or rebuilding a model nobody trusts.