
Demand generation builds interest in a problem and your approach to solving it. Lead generation turns interest into identifiable contacts you can follow up with. The costly mistake in lead generation vs demand generation is treating those contacts as evidence that people want to buy.
A webinar registration proves someone wanted access to a webinar. Your reporting still has to establish whether they fit, asked for help and became a credible sales opportunity.
Lead generation vs demand generation: what changes in the scorecard?
Demand generation measures whether the right market is becoming interested in your solution. Lead generation measures whether you capture usable contacts and move suitable buyers toward a conversation. Both need a revenue check, but neither a form count nor a short-term pipeline report tells the whole story on its own.
| Decision | Demand generation | Lead generation |
|---|---|---|
| What are we trying to change? | Awareness, understanding and preference | Identifiable interest and next-step uptake |
| Who are we measuring? | Target audiences and accounts | People, then their associated accounts |
| What is early evidence? | Relevant reach, research engagement, recall | Usable contacts and explicit requests |
| What checks quality? | Whether the audience fits the market | Fit, request context and sales acceptance |
| What is the business check? | Pipeline and revenue over a suitable horizon | Opportunities and wins from capture cohorts |
| What can mislead us? | Calling impressions buyer intent | Calling every submission a qualified lead |
Here, lead generation includes attracting and identifying potential leads; capture is the form, registration or conversation that records their details. Demand generation is the wider job of developing interest, with lead generation inside that program. Our B2B demand generation overview gives the broader strategy context.
Don’t sort channels into permanent buckets. An educational webinar can build understanding and collect registrations. Paid search can introduce a category or capture someone already comparing vendors. Label the campaign’s job and offer before choosing its metric.
Which demand generation metrics show more than exposure?
Measure whether you reached the intended audience, whether its understanding or preference changed, and whether suitable accounts later entered a buying conversation. Keep those observations separate. Impressions establish delivery; engagement records behavior; neither alone proves incremental demand. A useful scorecard names the evidence available and the uncertainty that remains.
Start with your ideal customer profile. If you sell planning software to finance teams at midmarket SaaS businesses, broad interest in productivity isn’t enough. Look for evidence that finance buyers at relevant companies are consuming the material, while acknowledging where your analytics cannot identify them.
For paid distribution, review audience composition and frequency alongside reach. On your site, examine engagement with the specific planning problem and later visits to evaluation content. Treat branded-search movement as a supporting signal: a hiring announcement or unrelated news can also produce searches.
To investigate changed awareness, use a consistent survey question in a relevant audience or a properly designed brand-lift study. Keep the population and sampling method comparable. Ten enthusiastic replies from your newsletter subscribers won’t tell you how the wider market sees you.
Set a review window from your own sales cycle and campaign objective. A weekly delivery check and a later business-outcome review serve different purposes; write down both dates before launch.
Which lead generation metrics survive a CRM audit?
Count unique, usable contacts before calculating lead costs, then follow a defined group through fit review, sales acceptance and opportunities. Keep submissions, people and accounts in separate columns. A cheap form fill can be expensive to process, and a second contact at an existing account is not automatically a second opportunity.
Define a usable contact in operational terms. For example: a deduplicated record with sufficient information for the promised follow-up, excluding spam and test submissions. That definition doesn’t certify budget or intent, and it doesn’t replace your organization’s rules on permitted communication.
Then distinguish fit from readiness. A finance director at a suitable company may download a planning worksheet for next year. Another may ask for a walkthrough because their current contract expires soon. Those are different follow-up jobs even if both fit your market.
If you use a marketing-qualified lead stage, attach its entry criteria to the report. A label without a definition is difficult to audit. Show the number accepted by sales, the reasons for rejection and the contacts still awaiting a decision.
Google Ads makes a related distinction in its documentation for qualified and converted leads: qualification can happen outside Ads, and a converted lead can represent a chosen later milestone. Check your configuration before reading “converted” as “paid customer.” The platform label cannot repair an unclear CRM definition.
Lead generation vs demand generation: how does one campaign add up?
Read the campaign as a set of related observations, not one seamless funnel from every impression to every deal. Track exposure separately, reconcile captured people, and count opportunities once. Use one acquisition cohort and give each member the same follow-up window before comparing its outcome with another cohort’s outcome.
Consider a hypothetical B2B SaaS campaign for finance-planning software. These numbers illustrate reporting choices; they are not benchmarks, a forecast or a Breadcrumbs customer result. The campaign runs for eight weeks and costs $12,000, including media, content production and operations. All amounts in this example are US dollars.
The offer is an ungated walkthrough of a forecasting problem, with an optional live workshop and a separate request for a product conversation. The team reports 40,000 paid impressions and 900 engaged site sessions. Those are delivery and engagement measures, not 40,000 people or 900 known target accounts.
For the captured cohort, every person gets 90 days of observation after their first capture. The final outcome report therefore waits until the last capture has had its full window. Save each person’s cutoff as first-capture timestamp plus 90 days, and exclude later events from that person’s 90-day result.
| Observation | Count | Counting rule |
|---|---|---|
| Registration and inquiry submissions | 360 | Events, including repeats |
| Unique captured people | 320 | Remove 40 repeat submissions |
| Usable contacts | 260 | Remove 60 unusable records |
| Contacts meeting the fit rule | 180 | Subset of usable contacts |
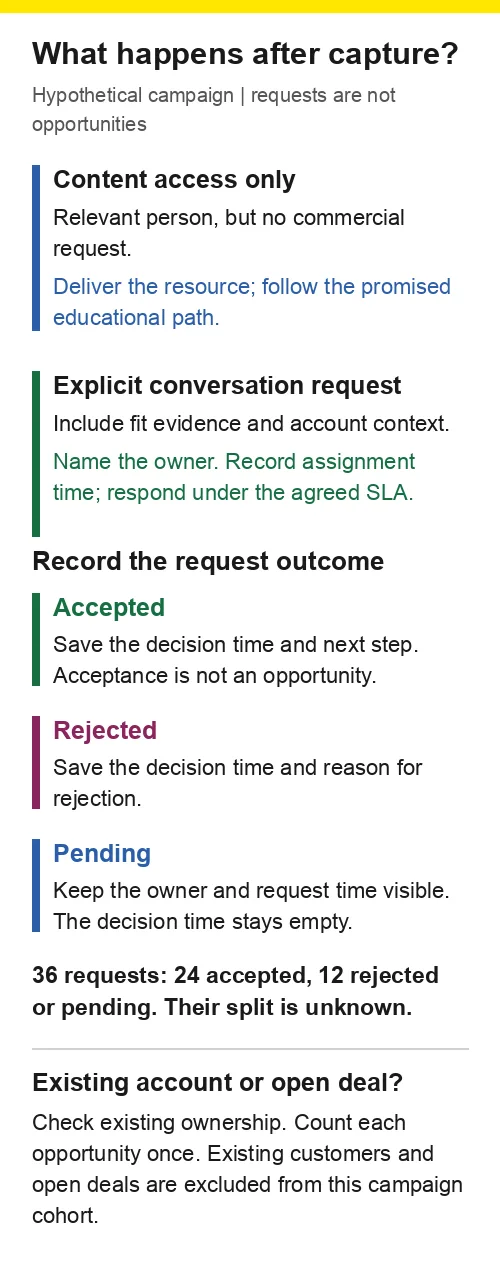
| Fit contacts requesting a conversation | 36 | Explicit request during the window |
| Requests accepted by sales | 24 | Subset of those 36 requests |
| New opportunities created | 12 | Distinct new-business accounts |
All later rows are linked back to that captured cohort. Existing customers and already-open opportunities are excluded from this example. Multiple people can belong to one account; the opportunity total comes from unique opportunity IDs, not a sum of contacts.
This is a reporting convention, not a claim that every buyer follows the same sequence. Keep people who enter through a different route visible in a separate cohort rather than forcing them into this one. For an opportunity shared by several captured contacts, choose and record one cohort-entry rule before comparing periods; do not count it once per contact.
What does a lead cost here?
Using total program cost throughout, cost per submission is $12,000 / 360 = $33.33. Cost per usable contact is $12,000 / 260 = $46.15. Cost per sales-accepted request is $12,000 / 24 = $500.
All three figures are valid answers to different questions. Label the numerator as total program cost: these are not paid-media-only CPL figures. If finance allocates only part of the shared cost to lead capture, show that allocation separately and apply it consistently across comparisons.
For a reproducible worksheet, also retain cost per unique captured person ($12,000 / 320 = $37.50) and cost per distinct opportunity ($12,000 / 12 = $1,000). The usable-record rate is 260 / 320 = 81.25%; fit among usable records is 180 / 260 = 69.23%. These describe this example’s filtering, not targets for another campaign.
The request-acceptance rate is 24 / 36 = 66.7%. The fit-to-request rate is 36 / 180 = 20%. Neither is the same measure as opportunities per usable contact, which is 12 / 260 = 4.6% and describes distinct opportunities relative to the person cohort, not a person-to-person stage conversion.

What does the pipeline prove?
Suppose each of the 12 opportunities has a $15,000 first-year contract value. The cohort is associated with $180,000 in unweighted pipeline. That is not booked revenue, profit or proof that the campaign caused $180,000 of demand.
Check where usable contacts became requests and whether the 12 unaccepted requests were rejected or still awaiting a decision. Then inspect which opportunities progressed. If acquisition gets cheaper while rejected requests increase, investigate the audience, offer and acceptance criteria before buying more traffic.
What evidence should travel with the sales handoff?
Pass the reason for the conversation, account context, relevant fit evidence and a named owner. A request for help should enter the agreed response process without waiting for an arbitrary engagement score. Educational engagement alone belongs in a different follow-up path until the buyer or another qualifying signal justifies sales involvement.
For the hypothetical campaign, a useful handoff record would say:
| Field | Example record |
|---|---|
| Offer and request | Workshop attendee requested a forecasting walkthrough |
| Account context | New prospect; no existing opportunity found |
| Fit evidence | Finance role; company size within the stated segment |
| Buyer-stated need | Replace a manual quarterly forecasting process |
| Missing evidence | Budget and evaluation timing not yet confirmed |
| Ownership | Named account executive; timestamped assignment |
| Next step | Respond through the requested channel under the team’s SLA |
This is an example record, not a real prospect. It gives sales something to act on without inventing certainty. The owner can accept the request, record a fit rejection, or return it for clarification; those dispositions make the next report useful.
Behind that readable summary, retain campaign, person and account IDs, the first-capture timestamp, usability reason and the version of the fit rule applied. Store request, assignment and decision timestamps separately, with a rejection reason or a pending status. When an opportunity exists, attach its ID, creation date and value basis so another analyst can reproduce the ledger without guessing what a stage label meant.
Keep a content-only contact on the promised educational path. Repeated clicks can justify closer review, but don’t turn missing commercial context into a confident buying-intent claim. A B2B lead scoring model can keep fit and activity visible as separate inputs; it should not conceal the underlying evidence.
How should attribution affect your demand generation report?
Use attribution to explain which recorded interactions receive credit, then distinguish that report from an estimate of incremental business impact. Keep your campaign membership and source rules explicit. A contact can interact with several campaigns, so adding their influenced-pipeline totals can count the same opportunity more than once.
Store the first captured source and subsequent campaign interactions separately. Associate contacts with accounts and opportunities, preserving the observation dates. Define whether “sourced” means the first known marketing touch, the inquiry source or another agreed rule; don’t change the definition when a different report looks better.
Version that sourcing rule and retain campaign-influence flags alongside the observation cutoff. An anonymous impression cannot reliably supply a named person’s missing history; leave the join unknown rather than treating an inferred account match as proof of exposure.
Google Analytics describes attribution as allocating credit among touchpoints. Its models use different rules and data, and its data-driven model estimates contributions from observed paths. Your CRM campaign-member report does not automatically measure everything a buying group saw, discussed or remembered.
For the hypothetical campaign, report the $180,000 as pipeline associated with the defined cohort. If another campaign touched those accounts, show the overlap. For a causal budget decision, consider an appropriately designed holdout or experiment when feasible, with sample size and sales-cycle limitations made explicit.
When the tracking is incomplete, present the attribution report alongside what buyers told sales and what your experiments found. Our marketing attribution guide covers the model choices in more detail.
Where should the next campaign dollar go?
Put the next dollar against an observed constraint. Weak relevant reach calls for a different response from a broken capture path, poor fit or unworked requests. Compare cohorts at the same age and check sales capacity first. Otherwise, a budget change may simply send more people into a process that cannot handle them.
| What you observe | What to investigate before spending more |
|---|---|
| Delivery is high; target audience evidence is weak | Targeting, message and where the audience spends time |
| Relevant engagement is rising; few people take the offered next step | Offer relevance and capture friction |
| Contacts are usable; few fit the target | Audience selection and promises made in the creative |
| Fit contacts request help; acceptance is low | Rejection reasons and the agreed acceptance rule |
| Accepted requests stall | Ownership, follow-up capacity and buyer-reported barriers |
Avoid a universal demand-gen/lead-gen budget split. Your market, sales cycle and existing demand determine what to test next. Protect the longer observation window for demand-building work while holding the team accountable for delivery and audience quality now.
At your next campaign review, open the capture ledger beside the sales dispositions. Pick the first drop-off you can’t explain and assign someone to inspect the underlying records before changing the budget.
Use the B2B lead scoring guide to define separate fit and activity inputs for that review.