
One demo, two attendees, three CRM records. If each record earns points, your account scoring model can turn one conversation into three separate buying signals. The account rises in the queue even though nothing new happened.
An account score helps prioritize companies using evidence across their contacts. Before adding points, check whether each record describes a new event or a copy. Then keep track of who took part: two attendees can reveal more about a buying group without turning one meeting into two.
Start with an event ledger you can explain. The synthetic example below takes seven source records from 110 apparent points to 50 counted points, while keeping company fit and buying-role coverage separate. Every weight is illustrative. The calculation is reproducible; it isn’t a benchmark or a claim about sales performance.
What should an account scoring model actually decide?
An account scoring model should help an owner decide which account and product conversation deserves attention next. Define the sales motion and the evidence cutoff before calculating anything. Keep company fit, recent engagement and buying-role coverage visible, so the owner can distinguish activity from suitability and identify what still needs checking.
For this example, the unit is account A17, product P1, new business, model version 1, at a fixed snapshot time. A score without that context invites mistakes: an existing customer’s support activity might enter an acquisition queue, or interest in one product might inflate another product’s priority.
A result of 50 means that this model counted 50 engagement points. It doesn’t estimate a purchase probability. You also can’t infer that the account has twice the revenue potential of one with 25 points.
The difference between account scoring and lead scoring is the unit you evaluate. Individual contact activity becomes evidence for an account-level decision. It shouldn’t make company attributes count repeatedly just because your database holds more contacts there.
Start with the broader B2B lead scoring framework if you still need to choose your inputs and evaluation approach. Here, the job is narrower: make the aggregation traceable enough that a salesperson can challenge it with a specific source record.
Which contacts and signals belong to this buying group?
Include contacts whose account association and product relevance you can support. Keep ambiguous associations in a review queue before calculating priority. Define which buying roles matter for this product and motion, and record the evidence for each role. Several people at one company don’t automatically form one relevant buying group.
Account identity is an input to this workflow. A shared email domain, a consultant working with several clients, or an unresolved subsidiary relationship needs a matching decision first. Assigning uncertain records a low engagement score hides an identity problem inside a prioritization rule.
Use a stable account ID and product ID for the accepted records. Keep the original source IDs too: you’ll need them when someone asks why a record moved, disappeared or contributed points. Good CRM data quality makes that investigation possible; a cleaner-looking total doesn’t repair missing provenance.
Buying groups also need a product boundary. Adobe’s buying-group blueprint describes role templates linked to solution intent, with individuals potentially appearing in more than one group. That’s a useful design distinction, not proof that every person interested in product P1 is also considering P2.
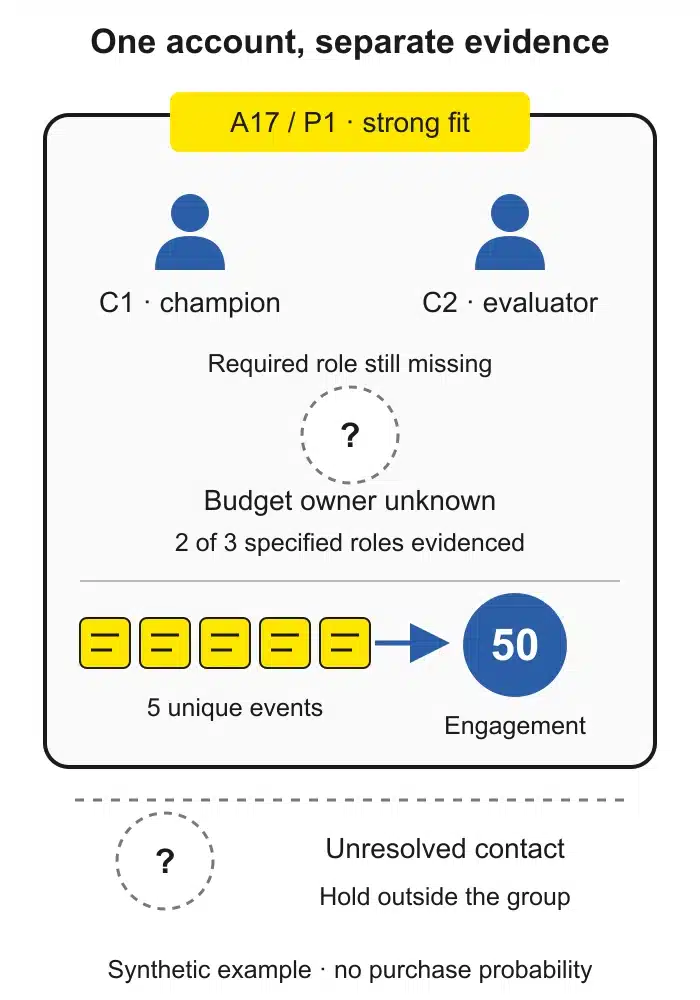
In the example, C1 and C2 are confirmed contacts for A17/P1. C1 fills a champion role; C2 fills a technical evaluator role. Those roles are explicit synthetic assumptions recorded alongside the event fixture, not conclusions inferred from page views.
The chosen template also asks for a budget owner, who remains unknown. If an ambiguous third contact arrives, hold the association for review rather than treating that person as the missing budget owner.
Set eligibility before weights. Existing customers and open opportunities need policies for their own motions; job-seeker traffic shouldn’t become acquisition interest. Suppressed contacts remain subject to the applicable contact policy. A higher score doesn’t grant permission to send a message.
How do you aggregate contact engagement without double counting?
Aggregate unique occurrences, then apply your time and event-class rules. Keep the source records that describe each occurrence, but don’t award fresh points for a sync copy or another attendee’s copy of the same meeting. Preserve genuinely separate events, even when they involve the same person and page.
Here’s the complete seven-row example. All rows belong to A17/P1/new business at the same snapshot. A demo starts at 20 points, a pricing view at 10 and a webinar at 10; these invented weights make the arithmetic easy to inspect.
| Source row | Occurrence and evidence |
|---|---|
| 1 | demo-1: C1, calendar, 5 days old |
| 2 | demo-1: C1, CRM copy, 5 days old |
| 3 | view-1: C1, pricing view, 3 days old |
| 4 | view-2: C1, pricing view, 2 days old |
| 5 | demo-1: C2, second attendee, 5 days old |
| 6 | webinar-1: C2, event platform, 7 days old |
| 7 | demo-2: C2, earlier demo, 40 days old |
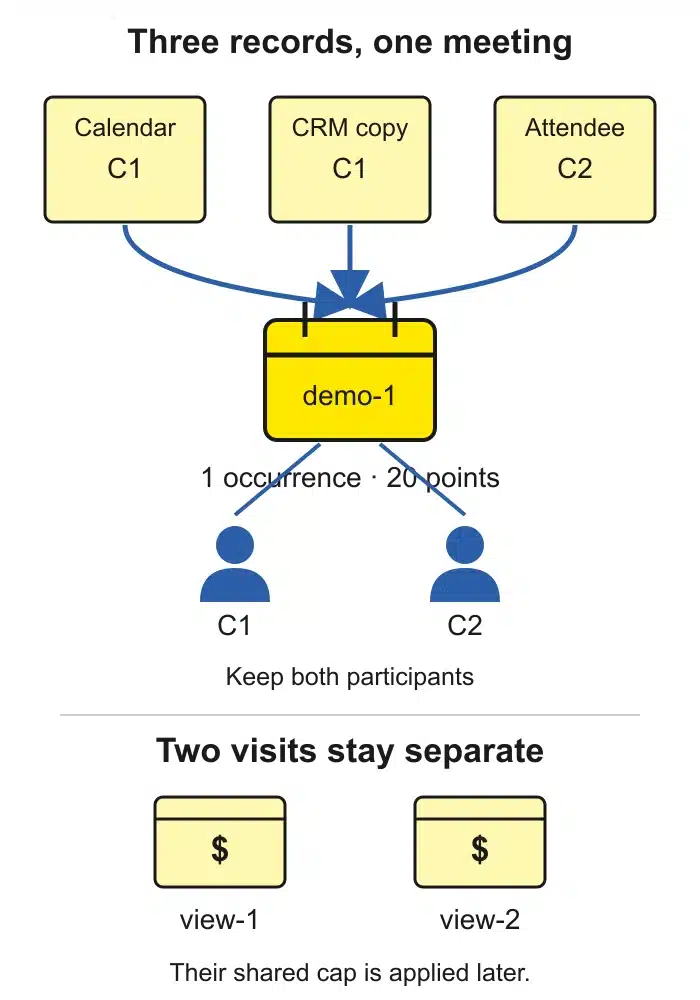
Adding source rows gives 110 points: four demo rows at 20, two pricing rows at 10, and one webinar row at 10. But rows 1, 2 and 5 all describe demo-1. Counting that completed meeting once removes 40 duplicate points, leaving five occurrences worth 70 before time rules.
Rows 3 and 4 survive. They’re two distinct pricing events with different occurrence IDs, not duplicate copies. Later, a cap will limit their combined contribution; deleting the second event would lose evidence and confuse the reason for the reduction.
The earlier demo also survives. Its occurrence ID is demo-2, so it is independent of the recent meeting. Its age changes its weight in the next step, not its identity.
Choose the occurrence before choosing the sum
For each accepted record, retain the account, product, motion, occurrence ID, event type, timestamp and source reference. Your cross-system mapping determines that the calendar event and CRM copy describe the same occurrence. Matching a URL and a day alone is too weak: two legitimate sessions could share both.
If source systems disagree about an occurrence’s type or time, expose the conflict. The fixture checker rejects contradictory records instead of silently letting the last row win. A production implementation also needs an explicit policy for missing occurrence IDs and corrections; this small example doesn’t solve identity resolution.
Adobe’s Marketo account-score documentation illustrates account scores as sums of person-score fields and allows multiple engagement scores. That documents the aggregation mechanism. It doesn’t establish that summing those fields removes copies of the same underlying event.
Keep separate evidence of who attended. One meeting can support engagement once and reveal two participants without becoming two meetings. If your business deliberately values attendance breadth, name and evaluate that feature separately rather than hiding it inside duplicate event points.
How should account scoring caps and time decay change the result?
Apply time decay to the deduplicated occurrences, then cap each event class within the account and product being scored. State the order and the boundaries explicitly. Decay limits the influence of older activity; caps limit concentration in one kind of activity. Neither operation establishes whether two records describe the same event.
The example uses full weight from age 0 through 30 days, half weight from 31 through 60 days, and zero after 60 days. Demo points are capped at 30, pricing points at 10, and webinar points at 20. These are teaching assumptions, not recommended settings for your sales cycle.
The 40-day-old demo drops from 20 to 10 points. Everything else keeps its full weight, so the deduplicated total falls from 70 to 60. Then the two pricing views reach their shared 10-point cap, removing another 10 points.
| Event class | After decay | After class cap |
|---|---|---|
| Demos | 30 | 30 |
| Pricing views | 20 | 10 |
| Webinar | 10 | 10 |
| Total | 60 | 50 |
The full reconciliation is 110 → 70 → 60 → 50: source-row sum, unique-occurrence sum, decayed sum, capped sum. Keep those intermediate totals available during an audit. A single final number makes it harder to see whether the reduction came from a copied event, age or a cap.
HubSpot’s score-builder documentation describes company fit and engagement scores, association filters, sum/average/min/max aggregation, event or group limits, and decay. Available score types depend on subscription. Those are separate configuration choices; this fixture wasn’t executed in HubSpot and doesn’t claim to reproduce its decay implementation.
Make changes explainable over time
Replaying the same input must leave the result unchanged, and changing row order mustn’t change which occurrence wins. The example’s checker tests both. It also checks the day-30, day-31, day-60 and day-61 boundaries and rejects a conflicting occurrence.
For real timestamps, document the timezone and whether age means elapsed time or calendar days. A late-arriving event should retain its occurrence time instead of becoming fresh because an integration delivered it today. Distinguish a score recalculated with newly received evidence from the score that was actually available to the owner at the earlier snapshot.
Retain both the model version and calculation time. Otherwise, an apparent fall in engagement could really be a rules change, and your team would be explaining buyer behavior that never happened.
How do fit and buying-group coverage affect account scoring?
Use fit and buying-group coverage to interpret the engagement total and choose the next action. Keep company attributes attached to the account, and show evidenced roles against an explicit role template. Missing role evidence should remain visible as unknown. It shouldn’t quietly become zero company fit or another engagement bonus.
In this synthetic case, A17 has strong fit for P1. That is a declared input, not a result calculated from the event CSV. For a real model, document the firmographic attributes and other criteria supporting the classification, their sources, and when they were last checked. The guide to firmographic inputs explains the company-level data behind that work.
The role template asks for a champion, technical evaluator and budget owner. Two roles are evidenced, so coverage is 2/3 specified roles. It isn’t two-thirds of every person who will influence the purchase; the real committee could include procurement, security or other participants outside this simple template.
Put the outputs side by side: strong fit, 50 engagement points, two of three required roles evidenced, budget owner unknown. That gives the account owner a concrete gap to investigate. Reporting “117 points” by adding a rounded coverage percentage to engagement would mix unlike quantities and conceal the missing role.
Two people can fill the same role without increasing the number of distinct required roles covered. One person can also hold several roles, if evidence supports it, but that doesn’t establish several independent stakeholders. Store the people and the role assignments so reviewers can see the distinction.
Decide how these outputs affect priority through an explicit policy. For example, your pilot might ask an owner to review recent engagement and confirm budget ownership before advancing the conversation. That action is an editorial example, not a validated universal threshold.
An account-based marketing program then determines how to work the account. The scoring calculation supplies evidence for that decision; it doesn’t replace account strategy or sales qualification.
How do you validate an account scoring model before routing work?
Validate the model against evidence that existed before the outcome you want to predict, and evaluate it on a later cohort you didn’t use to choose the rules. Count eligible account/product units consistently. Inspect mistakes as well as successful outcomes, and separate model performance from differences in how sales teams worked the accounts.
Begin with calculation checks. The supplied seven-row CSV and Python checker reproduce the example without connecting to a CRM. Run the checker with the CSV in the same directory; its expected capped output for A17/P1/new business is 50.
The checker also copies the fixture into a second product group and verifies two separate 50-point results. This tests grouping, not whether a real event deserves to count for both products. You still need a rule for shared events; duplicating product IDs indiscriminately would spread the same evidence across unrelated demand.
Separate a calculation test from an outcome test
Arithmetic tests tell you that the implementation follows its stated rules. They don’t tell you whether demos deserve 20 points, whether a 30-day window fits your market, or whether the ordering helps owners choose better conversations. Test those assumptions using your own historical and prospective evidence.
Freeze inputs at the decision cutoff. Don’t let a later won/lost field, a future sales meeting, or company information enriched after that date enter the retrospective score. Otherwise, the model benefits from facts the salesperson couldn’t have known at the time.
Choose the outcome and observation window before comparing versions. If you measure accepted opportunities within a defined follow-up period, explain what “accepted” means and how accounts without a full observation window are handled. Keep those rules stable across the comparison.
Use eligible account/product units as the denominator, not contacts or activity rows. Under a hypothetical evaluation, 12 accepted opportunities among 80 eligible account/product units is 15%. Reporting those 12 against 240 contacts from the same accounts would answer a different question; neither figure is a benchmark from this article.
Then inspect treatment differences. If high-priority accounts receive better coverage, faster follow-up or more experienced reps, their higher conversion rate doesn’t by itself prove that the score caused improvement. Compare like-for-like cohorts where feasible, and state the remaining uncertainty instead of attributing all the difference to the model.
Review false positives and missed opportunities with sales. For every disputed account, ask whether the problem was incorrect identity, duplicated evidence, weak weights, missing roles or execution after handoff. Each diagnosis suggests a different fix; changing the threshold can’t repair all of them.
What must the account owner see next to the score?
Show the owner the account and product, current fit, engagement breakdown, evidenced buying roles, missing information and the reason for the latest change. Include the model version and calculation time, with links back to source evidence. Keep any human override visible alongside the calculated result so the next owner can understand both.
For A17/P1, the reason ledger would show one recent shared demo, one older demo at half weight, two pricing visits constrained by their class cap, and one webinar. It would preserve C1 and C2 as attendees while counting their shared demo once. The outstanding role question is budget ownership.
Record the next action and its owner separately from the numeric output. “Confirm budget-owner involvement” is a useful task if the conversation supports it; “contact everyone because the score is 50” ignores both the evidence gap and the contact policy.
When someone overrides priority, save the reason, author, timestamp and expiry while retaining the unchanged calculated score. Review expired overrides rather than letting an urgent exception become permanent hidden logic. If the underlying model changes, reviewers should still be able to reconstruct what the owner saw.
Start your next audit with one account whose priority surprised sales. Trace every counted point back to its occurrence, then identify the buying-role evidence that still needs confirmation.