

Unkover your competitors’ Marketing Secrets
Say goodbye to wasting hours on competitor analysis by equipping your team with an AI-driven, always-on competitive intelligence platform.


Say goodbye to wasting hours on competitor analysis by equipping your team with an AI-driven, always-on competitive intelligence platform.

Stay Ahead with AI-DRIVEN Competitive Intelligence
Unkover is your AI-driven Competitive Intelligence team delivering critical updates about your competitors the moment they happen:
Track your competitors website changes
Why spend all day stalking the competition when you don’t have to?
With Unkover, you’ll know instantly when your competitors tweak their messaging or shake up their pricing. No more endless scrolling through their sites or second-guessing your strategies.
Let us do the heavy lifting for you, ensuring you’re always in the loop by notifying you the moment a critical change happens on your competitor’s pages.
Sit back, relax, and keep winning—Unkover makes sure you’re not just in the game, you’re always a step ahead.


Read your competitors emails
Companies love updating their customers and prospects about relevant news, product updates, and special offers.
That juicy info from your competitors? It’s yours too. Unkover will automatically capture all their emails and bring them right to your doorstep—accessible to your entire team, anytime.
[COMING SOON: Our fine-tuned AI will sift through these emails, extract key information and send them over to the best team within your org. Less noise, more signal!]
We hear you! Unkover’s goal is not to flood you with tons of data points that no one in your team will ever read. We gather competitive intelligence from thousands of data sources and use AI to highlight actionable information to the right team in your company.
Say goodbye to noise. We’re 100% signal.
ROADMAP
We’re excited to get Unkover in your hands as soon as possible and keep building the best competitive intelligence tool with your precious feedback. The roadmap for the next few months is already exciting, so take a look!
While we build and deliver, here’s our promise to you: as an early tester and customer, you’ll lock in an exclusive bargain price we’ll never offer again in the future.

Spy on your competitors’ full marketing strategy: social, ads, content marketing, email flows, and more.

Track competitive Win/Loss analysis and build battle cards. Get alerted at every pricing change.

Get immediate alerts when competitors announce new features or major releases. Identify strengths and weaknesses from online reviews.

Get the competitive intelligence you need where you need it: Slack, eMail, MS Teams, Salesforce, Hubspot, Pipedrive and more.
slack integration
Unkover’s Slack integration lets you keep your whole team up to speed with your competitors’ updates.

Join now to lock in an exclusive 50% lifetime discount
For startups and small teams, it’s the essential toolkit you need to keep an eye on a select few competitors.

Up to 5 competitors

50 pages monitored

10 email workflows

3-day data refresh
$39
/per month
$ 79
50% discount
Billed annually
For growing businesses, it allows you to monitor more competitors, pages, and email workflows.

Up to 10 competitors

100 pages monitored

20 email workflows

1-day data refresh
$79
/per month
$ 159
50% discount
Billed annually
For large companies, it is tailored to meet the needs of multiple teams needing granular insights.

Custom number of competitors

Custom number of pages monitored

Custom number of email workflows

Hourly data refresh
Custom price
Billed annually

Lead scoring is something most marketers have heard of but have never bothered to put into action–despite nearly 40% of businesses reporting higher opportunity-to-sale conversion rates.
However, most lead scoring templates fail to take both the demographics and activity data into consideration when calculating the lead score–costing you valuable sales conversions in the process.
In this article, we’ll dive deep into what lead scoring really means and how to determine your key demographics and activity that will indicate your lead is as hot as molten lava.
Not only that, but we’ll also provide a bonus lead-scoring template and a handy guide for you to import directly into your own email database.
The path to better sales conversions is just a few paragraphs away–so let’s get started!
Even if you aren’t familiar with the term ‘lead scoring,’ it’s exactly what it sounds like.
Lead scoring is a process where you determine the value of a lead based on their attributes (like firmographics and demographics) and assign points to rank them from most likely to purchase to those who do not fit your ideal customer profile.
There are a few different types of lead scoring models that you might see, each with its own pros and cons.
100-Point Model #1–Your score is a number between 1 and 100, and the higher the number, the better your score. The score is based on both fit (demographics and firmographics) and activity.
Pros: Incredibly easy to set up and manage.
Cons: Doesn't factor time into the equation, so it can be easy to miss leads when their intent is the highest.
Hot vs. Cold model #2–Your score is represented by hot peppers or flames, with more hot items indicating a hotter contact. This scoring only looks at behavior and activity and doesn’t consider fit.
Pros: Also easy to set up and has a clear yes/no output.
Cons: Only works with fit or activity, meaning you miss a lot of intent signals by ignoring half the data.
Co-Dynamic Model #3–Your score has a letter and a number, with 16 possible combinations. The letter indicates the fit of the contact, ranging from A (highest fit) to D (lowest fit), and the number indicates the level of activity, ranging from 1 (highest engagement) to 4 (lowest engagement).
Pros: The most powerful type of scoring model as it takes all data into consideration. Allows you to fully segment your list based on where they are in the sales cycle to enhance your content personalization strategy.
Cons: Can be more difficult to set up manually without using a specialized tool.
Before diving into lead scoring templates and how to use them, we’ll start by defining both the Fit and Activity side of the models and how to create your own.
Lead scoring is the method of assigning points to contacts or potential prospects based on…
BANT is an acronym that stands for Budget, Authority, Need, and Timeline. It is a…
Lead qualification is a systematic process utilized by businesses to evaluate potential customers based on…
The Fit Model ranks your lead based on their fit into your preferred demographic categories. This is some of the easiest data to use as it’s something most companies already keep track of. These can be data points like:
This type of quantitative data can easily be taken from lead forms on your website and is quite easy to track. While you can use many different demographics for your lead-scoring templates, it’s best to stick to the ones that are the most important for your business.
A great way to determine the best categories for your lead-scoring templates would be to take inventory of your top customers and start from there. You will likely notice a pattern emerge within the industry, company size, and job title categories.
In a perfect world, your leads should have the same demographic qualities as your current customers. This would indicate that your marketing activities are aligned and targeted at those most suitable for your product or service.
After you determine which categories belong in your model, you’ll then need to decide how to weight each category individually out of a total score of 100 points (or more than 100 points.)
For example, if you’ve found that nearly all of your top customers share the same job title, you might weigh that more highly than you would company size, which doesn’t have as big of an impact.
An integral part is this step is making sure you are tracking the same data for all contacts in order to score them all against the same criteria. If you’re having issues with standardizing your data, check out our article on data quality for lead scoring.
The Activity Model is a bit trickier than the Fit Model but remains an important component in your overall lead score and is critical for any lead-scoring templates you use.
The Activity Model ranks your lead based on engagement with you and your business. These are typical actions, such as:
Given that these actions can be harder to track and merge into one platform than demographics, it’s no surprise that many businesses tend to leave out this model entirely. However, in order to get the most accurate lead score possible, tracking these actions are mission-critical.
Most CRMs have a dedicated lead-scoring engine you can use to help you score basic email activity like email opens or clicks. Things like product demos, phone calls (also using a virtual phone number), or other activities may need to be manually filled in by employees or synced through third-party integration tools like Zapier.
Just like the Fit model, you would need to choose the specific categories of activity and define which events have which weight out of a total of 100 points.
The last step of the equation is the lead score–the combined result of your Fit and Activity models.
When ranking both your Fit and Activity Models, you typically do so based on a scale of 1-100, as we’ve mentioned. By taking a look at the score of both the Fit and Activity models together, we come to something called a co-dynamic distribution.
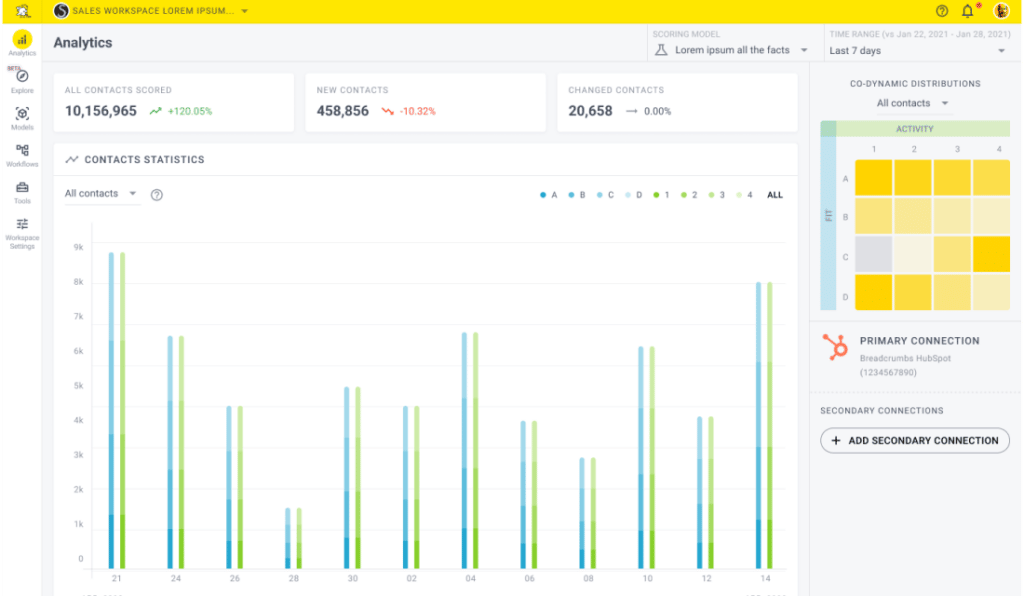
In this example of the Breadcrumbs dashboard, A-D represents the score of our Fit model, and 1-4 represents our Activity model. A perfect lead would meet the top score criteria for both the Fit (A) and Activity (1) models.
Those leads should be prioritized and directed toward the sales team immediately. Lower scoring leads (D4, for example) should be placed on the back burner until their score indicates they are ready to convert or are showing better signs of intent.
As you can see, many different lead scores can come out of tying the Fit and Activity model together in your lead scoring templates. Focusing on the ones with a higher score will help your team prioritize the right leads–allowing the sales team to close more deals in less time.
While using manual lead scoring templates will give us all of the benefits we mentioned above, there is one crucial element that it can’t help you with–and that’s saving time.
The lead scoring template we provide will help you determine your ideal Fit, Activity, and lead scores. However, applying that data to leads that exist in your database will likely be time-consuming and require significant daily effort to maintain.
That’s where Breadcrumbs comes into play.
With our Revenue Acceleration engine, Breadcrumbs makes this process easier by recommending the best model based on your type of business. We’ll update your lead score daily by checking both your Fit and Activity criteria and sending that info directly to your CRM, where your sales team can be notified instantly.
The best part? Breadcrumbs is absolutely free–so you can get started today at no cost to you.
For those of you who would rather do this process manually, you can continue reading to learn how to use our manual scoring spreadsheet.
Now for the most interesting part of the article–taking everything we’ve learned so far and putting it into action with our lead scoring template.
The very first thing you’ll need to do is download our lead scoring template. After that, you’re ready to continue onto the steps below.
Ebook
Lead Scoring Template
We’ve created this lead scoring template to help you demystify the process and create your own lead score based on the demographics and activity that mean most to you.
As we mentioned above, taking inventory of the demographics and activity of your top customers is a great way to get an idea of the categories you should be focusing on in the respective scoring models.
Once you’ve decided on the Fit and Activity model categories, you can start building your lead scoring template. The first step of which is the Fit model.
On your spreadsheet, navigate over to a tab titled ‘Step 1–Fit Categories’.
Let’s start out by focusing on the first column of the lead scoring template, the category column. These categories are going to be the main criteria for the Fit model, which relates to the demographic information about your leads.
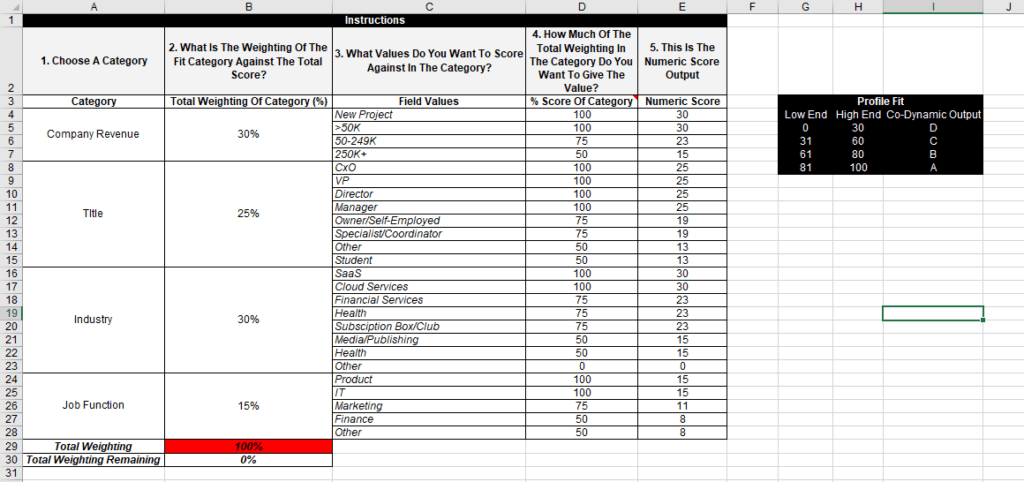
We’ve already pre-selected some categories for you, but you can create your own category by typing it in the box provided. Then, select the percentage of the total score that this category represents. Remember that the most important categories should receive more weight than others.
In column C of the lead scoring template, we need to put in our ideal values. In Layman’s terms, the ‘right answers’ that our prospective leads would answer to get a perfect score.
In column D, choose what score each answer would get out of a total of 100.
Column E of the lead scoring template states the numeric value of the score and does not need to be edited.
Continue adding in your categories, weights, and value in your lead scoring template until the Total Weighting cell reaches 100%.
After we configure the Fit model, the next step to putting together our lead scoring template is to configure the Activity model on Tab 2–Activity Events.’
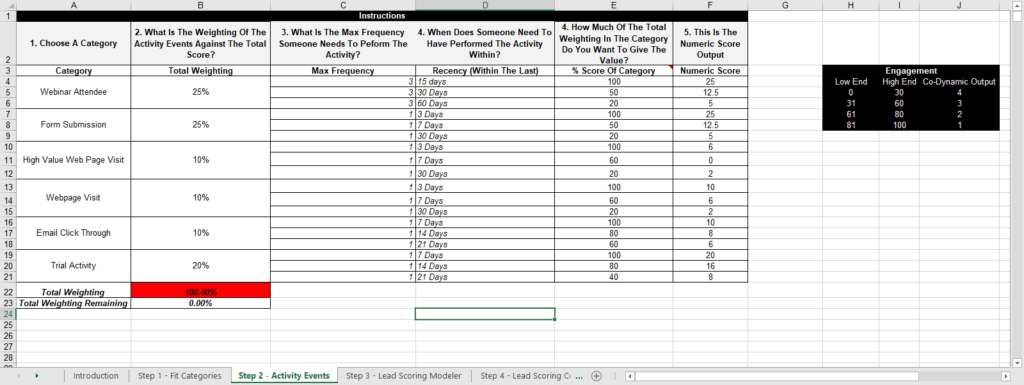
We’re going to follow the same logic as we did when configuring the Fit model. In this case, we’ll be choosing types of actions in the category field instead of demographics.
In column A of the lead scoring template, choose the event types that you want to base your total score off of. Again, we’ve pre-populated some ideas for you but feel free to write in your own.
Just as in the previous steps, in column B, add in the total weight that that specific action will carry out of the total (100%).
In columns C and D, things start to change from the previous tab. Here, we want to indicate the ideal number of times this action has been performed (C) during a specific timeframe (D).
Finally, in column E of the lead scoring template, add in the scores for each value. Again, you can leave column F as is.
After all our hard work, it’s time for the true fun to begin–looking at your lead score in action! After all, this is what using lead score templates is all about.
Navigate to the ‘Step 3–Lead Scoring Modeler’ tab.
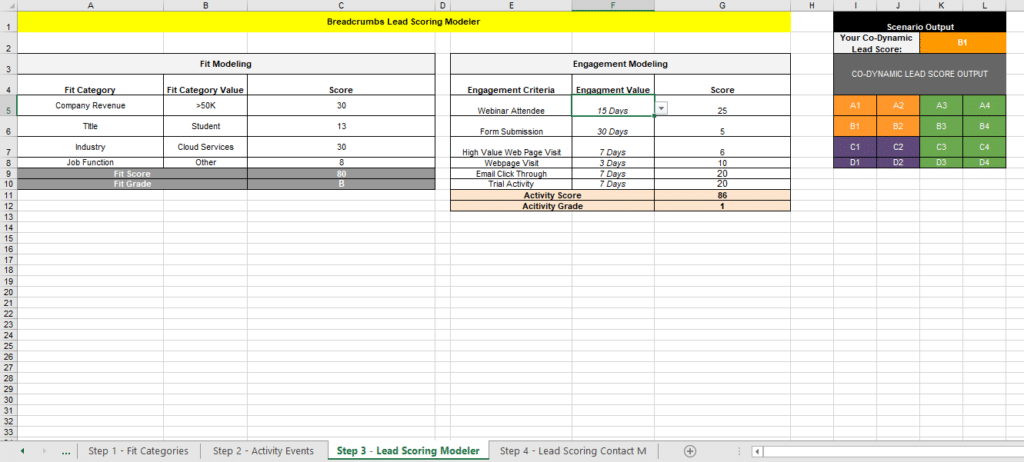
Here, you’ll see the list of both the Fit and Activity categories you’ve created inside the previous tabs.
At this step, you can choose from any of the matching values you entered and see what a sample score would look like in real time. You’ll be able to see the Fit and Activity scores/grades in their respective tabs.
To the right, you’ll see the Co-Dynamic lead score populated–which, as we mentioned, is the combined score of your Fit and Activity model.
Feel free to play around with this model and adjust the previous tabs until you’re satisfied with the results. When you’re ready, grab your list of leads and data–we’re about to put some real leads to the test of our lead scoring template.
The next step is for us to enter in our leads and their information into our spreadsheet and generate our scores. To do this, navigate over to the last tab of our lead scoring template called “Step 4–Lead Scoring Contact Modeler”.

Each row represents a specific individual, and columns contain the categories and values you’ve added in your previous tabs. Here, you’ll need to enter the specifics for every contact you wish to score.
At the end of these rows, the spreadsheet will automatically calculate your Fit and Activity scores and grades.
Once you’ve finished with this process, you’re ready to add this data into your email database.
Now, the easiest (and most exciting) part–adding this new information into your CRM! Most providers support .csv file uploads, and luckily our lead scoring template is easy to convert into this format. To do so, just click on File > Save Ads > Comma-separated values.
This will format the sheet into a .csv file for you to upload into your email database.
Remember, this process is entirely manual—meaning that if you want to keep your lead score up to date, you’ll need to repeat this process daily to ensure you’re striking while the iron is hot.
As we mentioned earlier, while creating a co-dynamic score is the best strategy for lead scoring, it can also be a lengthy process to set up and score manually—especially if you have a large list.
Luckily, you can create and implement your first lead scoring model for up to 10k contacts in Breadcrumbs for $0 with our free plan in just 3 steps. 😉
1. Connect your data source
The first thing you need to do is connect your primary data source (contacts & activity) to Breadcrumbs. You can also connect a secondary source if your contact data and activity data are stored in multiple tools.
We integrate directly with HubSpot, Salesforce, ActiveCampaign, Intercom, Segment, MixPanel, Mailchimp, and Pendo—for everything else, we also offer a custom API integration.
2. Create your Fit and Activity models
We’ve already given you all the tips and strategies here (as well as a fantastic lead-scoring template with both fit and activity scoring categories), so the next part is as easy as filling in the blanks.
All you need to do is map your CRM fields to the specific categories you want to set. For example, if you’re tracking pricing page visits in HubSpot, you’ll want to connect that field to your website for scoring. Or if you’re tracking in-product engagement, you’ll want to ensure you are tracking the right activities.
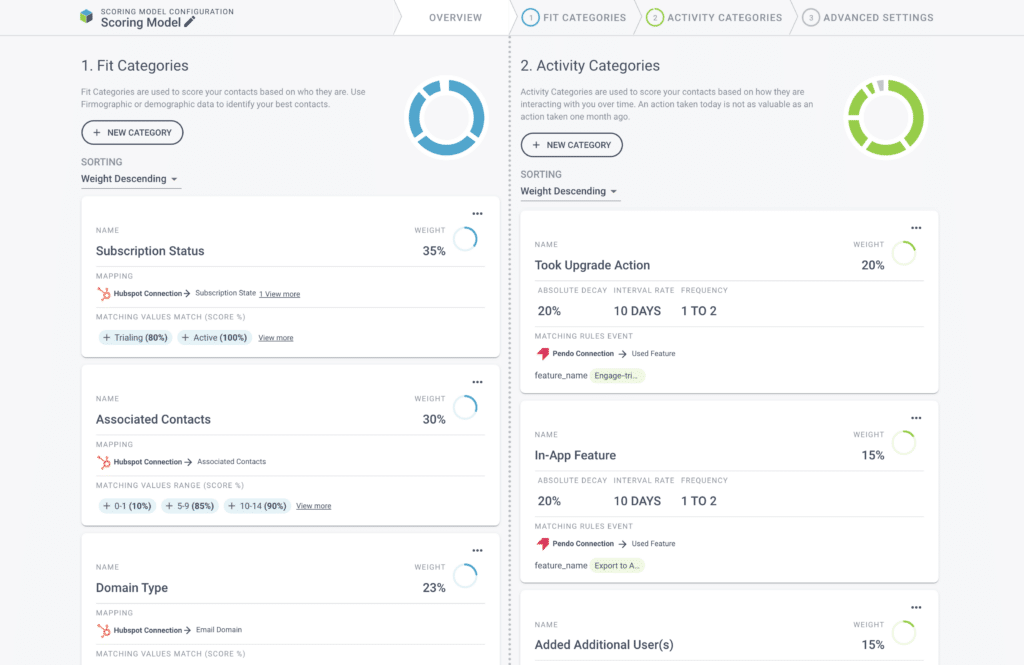
3. Activate and test your model
Once you’ve created your fit and activity models, you’re ready to put your new lead scoring model into action! You can:
And that’s all there is to it! Now you have a repeatable and scalable system to build, validate, test, deploy, measure, and tweak your models—all in just a few clicks.

Salesforce is one of the most high-powered sales and CRM-focused SaaS tools on the market…

Every good sales team needs a great customer relationship management (CRM) tool backing them up. …

Over the past decade, we’re sure that you’ve noticed that your marketing tech stack options…
A lead scoring template is a powerful tool that helps you create your lead scoring system. Setting up a lead scoring template will determine your ideal Fit and Activity custom scores for each lead by assigning points according to their behavior and profile information.
A lead scoring template is a great tool to get started, but like all manual tools, it’s time-consuming and hard to maintain and update.
This is why we suggest moving away from manual lead-scoring templates and using ML-powered tools like Breadcrumbs to quickly create, implement, iterate, and improve high-performing lead-scoring models.
A lead scoring model is a system sales, and marketing teams use to evaluate and rank potential customers, known as leads, based on their likelihood to purchase or engage with the business.
This ranking helps prioritize leads and allocate resources more effectively, ultimately improving conversion rates and sales performance.
In addition to ranking leads for sales, you can also use scoring models to find customers who are eligible for upselling/cross-selling opportunities or even those at risk of churn. That’s why we like to use the term contact scoring.
A lead scoring matrix is a framework or a table that helps businesses assess and prioritize their potential customers, known as leads, based on their lead scoring model.
After creating the scoring model, you can view your lead scoring matrix to view where your contact sits in terms of fit. The exact matrix you use will depend on the exact scoring model matrix you use.
Calculating a lead score involves assigning points to potential customers based on various factors that indicate their interest and likelihood to make a purchase. Here’s a general outline of how to do it:
In this article, we’ve given you tips on how to use lead-scoring templates to improve your sales conversions and taught you a little about lead-scoring in the process. We’d love to hear about any ah-ha moments or conclusions you came to about your own lead-scoring process–so let us know in the comments below.
You made a lead scoring template that is very simple to use, thanks! And the article shed light on what to add to my lead scoring, in particular I’ll be implementing the activity model.
Great piece! Very clear content and actionable tips to quick start lead scoring. I loved the ability to use lead scoring templates immediately, super easy to use even if in the long run it can surely be time consuming to do it manually.
Thank you for giving us a lead scoring template that would be easy & efficient to kick off with. Great article, I feel like I understand lead scoring a bit better & I love this easy to use lead scoring template.